


Stocks, Gold and Oil Markets Chopsville
Stock-Markets / Stock Markets 2015 May 03, 2015 - 03:13 PM GMT

 SPX
SPX
Last week we were looking for new highs on the SPX, the prior declines have all been corrective move so as long as that continues I don't see much in the way of any evidence to support a bearish reversal. Don't get me wrong I am now looking for a reversal but the market appears to be clinging on for dear life as it chops higher. This back and forth choppy price action is more and more supporting the ending diagonal idea that we have been tracking since the start of the New Year. It would need a strong advance above 2070SPX to cast doubt on the idea.
SPX Chart
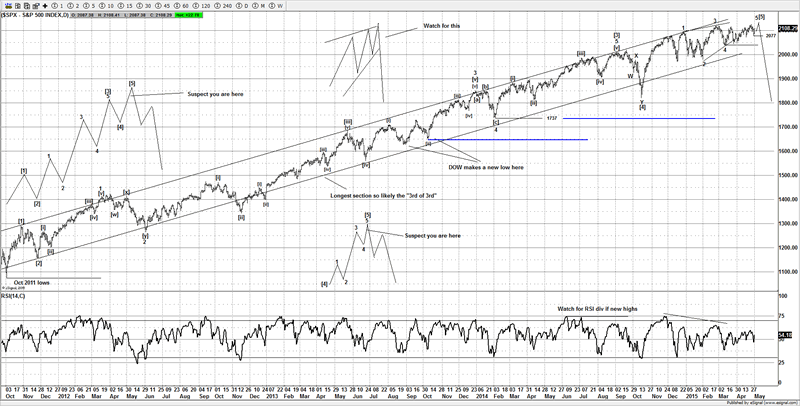
So whilst it's a valid we will keep the idea as our primary idea. If I am correct about the idea, then we should be on the verge of a nasty decline, although to really support the idea of a move lower it would have to take out some key support areas at 2060 & 2040. It tried to break down early last week, but again the decline was a corrective looking move and we looked to buy the lows for a move higher. Above 2077 now favors a new all time high again, it's at that point we will look to flip to being bearish and sell against 2070SPX. Ideally we see a minor new all time high then an aggressive reversal. We don't have any evidence yet of a reversal, each time it tries to break down its showing a 3 wave corrective decline, that's bullish and each time it's done that the market has made new highs.
SPX Chart 2
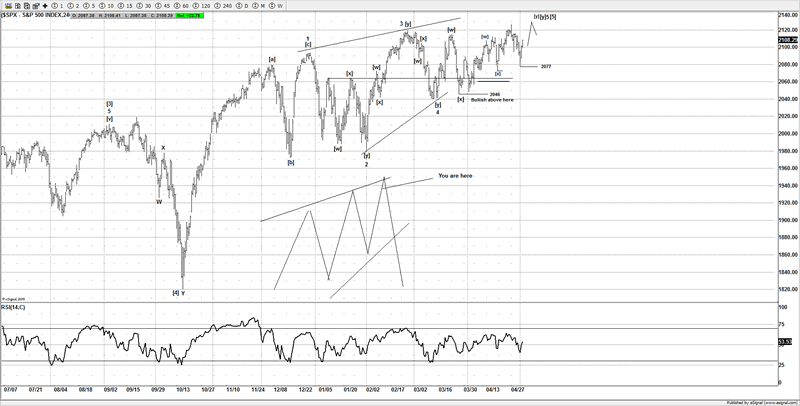
So readers can watch for a new high that again fails to see any follow through that would offer a decent setup to sell the market, if you are unsure when or where to enter, come and join us and stay up-to-date with this idea and many more ideas.
VIX Analysis
I am not exactly a fan of timing the market using the VIX but I think in this case it may offer some strong evidence to support our current thesis on the US markets. I still think we can see that target area at 12.00 - 11.50 tested before it sets up for a larger move higher.
VIX Chart
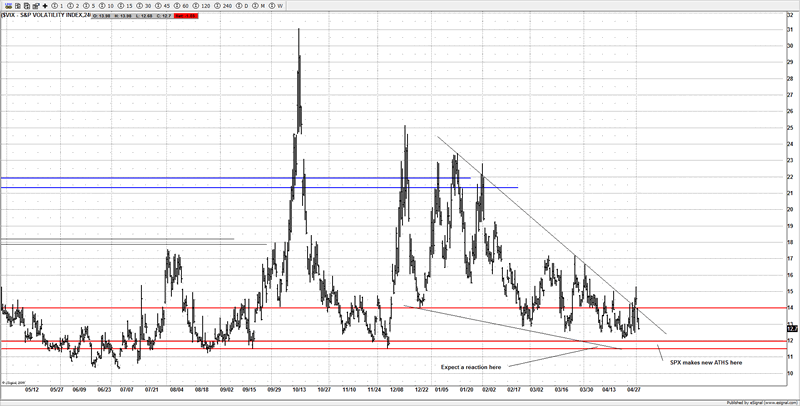
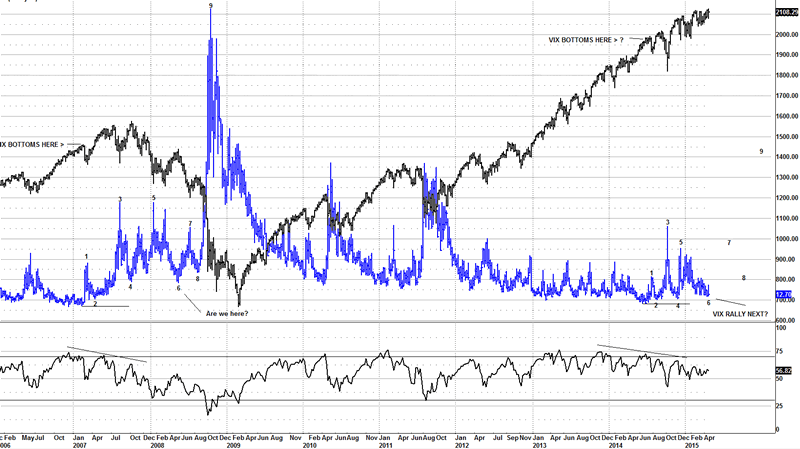
Looking at the recent swings I can make a case that history maybe repeating itself, if the market is now at point 6 then we should be very close to a strong reversal and a move higher in the VIX, if that were the case then by default it should see the SPX move lower. As if volatility spikes, generally speaking US stocks tend to move lower.
VIX Chart 2
Taking a closer look at the VIX price action it's been wedging for a while now and I think it's getting very close to a reversal, if we look back at the last time it started to wedge it gave a heads up that volatility was about to spike, I think the same message is happening again for those that are looking for clues.
VIX Chart 3
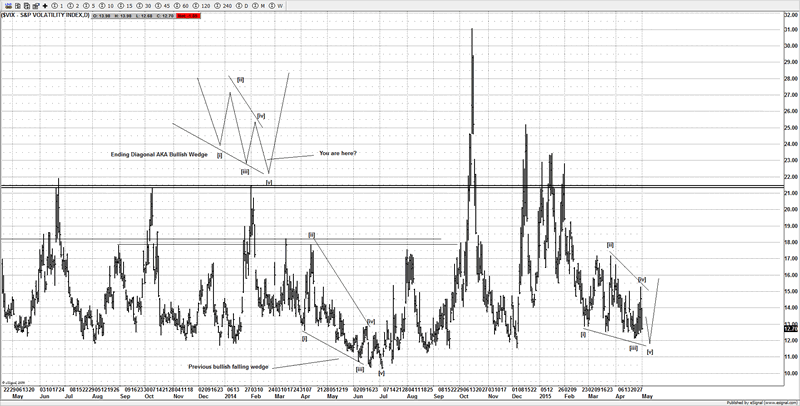
Those that are ignoring this clue could be in for a surprise, as the VIX is moving into support and has an overall wedge look; I think it be a precursor to a spike in volatility that is lurking around the corner.
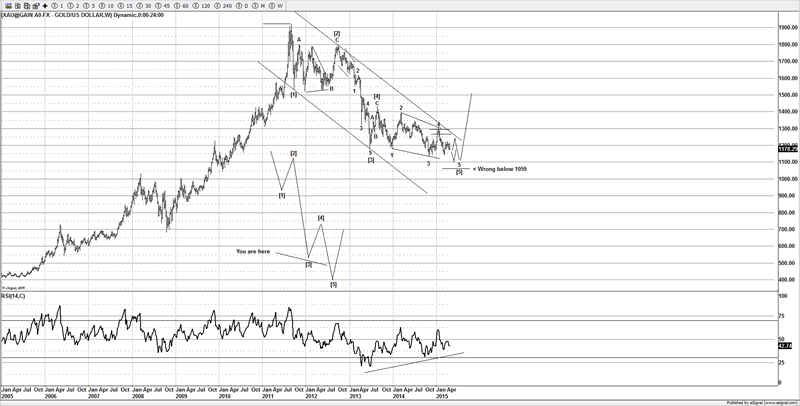
Gold
It's been a while since I last wrote about Gold, back in November we were looking for a potential major low to end a 5 wave decline from the 2011 lows, whilst we got a nice move, it failed short of the expected move, so we have had to adjust and allow for a new low under $1131. Currently I favor the market will likely make a new low under $1131, but ideally we see a bounce first towards $1250 to end wave [b] of wave 5, then setup for a move lower and test $1100-1131. The idea is wrong below $1142, if a break of $1142 then it's likely already moving lower and going to test the $1130-1100 area to end the suspected ending diagonal and the move from the all time highs made in 2011.
Gold Chart 1
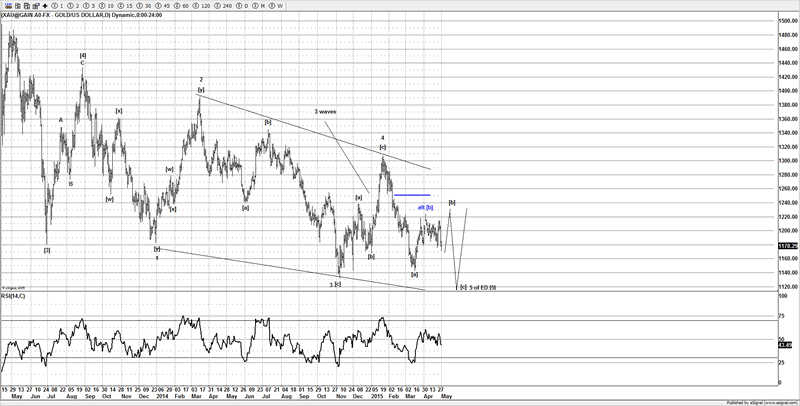
A closer look suggest the current move is likely a correction against the prior decline at just over $1300, however I still think the bulls have a small rally left in them before it moves lower and test the prior lows made at $1131, that will then offer the bulls a great opportunity to buy and setup for a much larger move higher. It's getting on for nearly two years and Gold has move sideways/down. It's frustrated many of the hardcore bulls. Ideally we see a move lower to finally put the nail in the coffin in the last remaining bulls. Whilst many will be panicking if the market moves under $1131, we will be busy looking for buy setups.
Gold Chart 2
Crude Oil
Back in March 2014 many traders and the media were freaking out about the decline on oil, but what they failed to realize is that it spiked from a 4th wave thrust. Elliotticians once again were one step ahead of the crowd. We had a target of $40-42 for the end of wave 5 of [3]. The low came in at $42.02, so not a bad "guess".
Crude Oil Chart 1
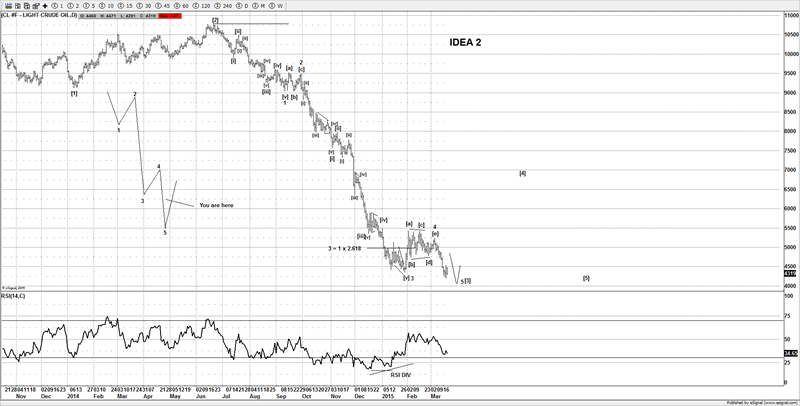
Once we had enough gyrations in place I warned members not to be bearish here as a large rally was setting up. True to my word we now have the rally that was forecasted and we are now again back to the lower end of the wave [4] target. Many traders will have switched bias and got bullish, but it's now that were are turning bearish and looking for a move lower. If I am correct members will have a nice trade ahead of them to sell and look to try and ride it back under $40 to end wave [5].
Crude Oil Chart 2
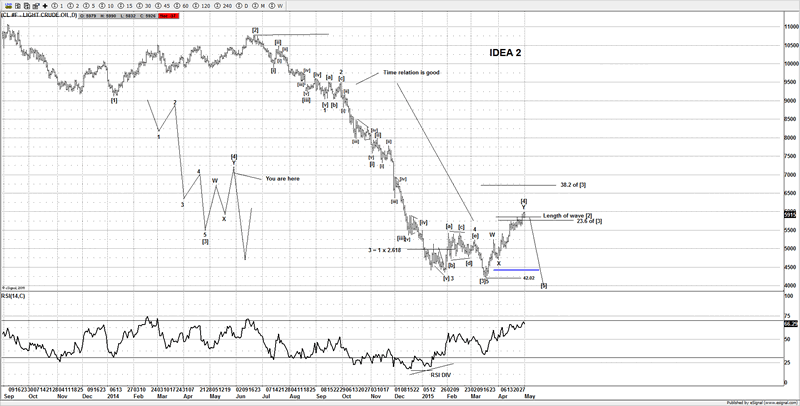
We are looking for some sort of strong impulsive decline to confirm the reversal, so far we don't have that, but as soon as we do get the evidence we will look for a setup to sell. It has enough gyrations for us to be very cautious on the long side.
Until next time,
Have a profitable week ahead.
Click here to become a member
You can also follow us on twitter
What do we offer?
Short and long term analysis on US and European markets, various major FX pairs, commodities from Gold and silver to markets like natural gas.
Daily analysis on where I think the market is going with key support and resistance areas, we move and adjust as the market adjusts.
A chat room where members can discuss ideas with me or other members.
Members get to know who is moving the markets in the S&P pits*
*I have permission to post comments from the audio I hear from the S&P pits.
If you looking for quality analysis from someone that actually looks at multiple charts and works hard at providing members information to stay on the right side of the trends and making $$$, why not give the site a trial.
If any of the readers want to see this article in a PDF format.
Please send an e-mail to Enquires@wavepatterntraders.com
Please put in the header PDF, or make it known that you want to be added to the mailing list for any future articles.
Or if you have any questions about becoming a member, please use the email address above.
If you like what you see, or want to see more of my work, then please sign up for the 4 week trial.
This article is just a small portion of the markets I follow.
I cover many markets, from FX to US equities, right the way through to commodities.
If I have the data I am more than willing to offer requests to members.
Currently new members can sign up for a 4 week free trial to test drive the site, and see if my work can help in your trading and if it meets your requirements.
If you don't like what you see, then drop me an email within the 1st 4 weeks from when you join, and ask for a no questions refund.
You simply have nothing to lose.
By Jason Soni AKA Nouf
© 2015 Copyright Jason Soni AKA Nouf - All Rights Reserved
Disclaimer: The above is a matter of opinion provided for general information purposes only and is not intended as investment advice. Information and analysis above are derived from sources and utilising methods believed to be reliable, but we cannot accept responsibility for any losses you may incur as a result of this analysis. Individuals should consult with their personal financial advisors.
WavePatternTraders Archive |
© 2005-2022 http://www.MarketOracle.co.uk - The Market Oracle is a FREE Daily Financial Markets Analysis & Forecasting online publication.