


Gold – Commitments of Traders – hedge fund longs liquidate
Commodities / Gold and Silver 2016 Oct 10, 2016 - 10:10 AM GMTBy: Dan_Norcini

 Fortunately for we traders, the Commitments of Traders report did at least catch the big move lower on Tuesday of this week so we were able to get a peek inside the market to see what happened to those massive hedge fund long positions during this week’s meltdown in the gold price.
Here is the first chart. Hedge fund outright positions.
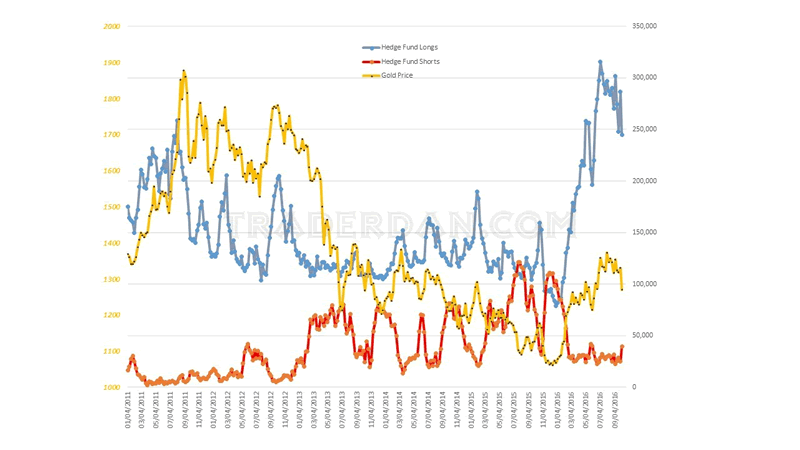
We had a sharp drop in hedge fund long positions ( a bit more than 42,000) in the plunge from $1330 the previous Tuesday to $1269.70 this past Tuesday.
We also had this category of traders begin moving into the short side to the tune of adding 14.6 thousand new short positions.
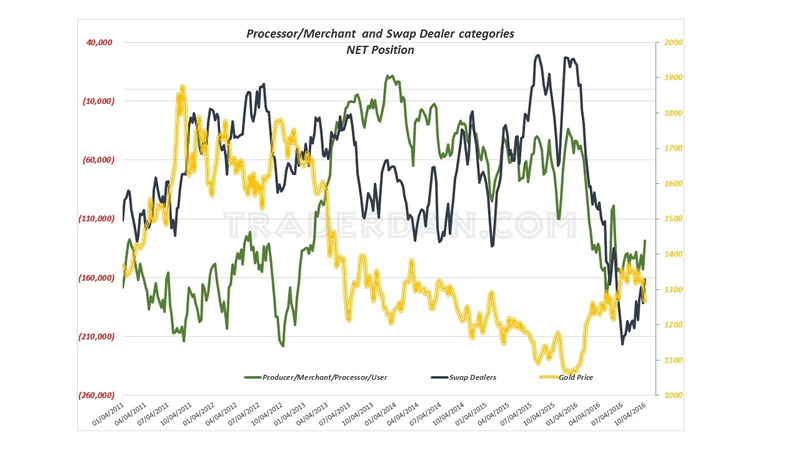
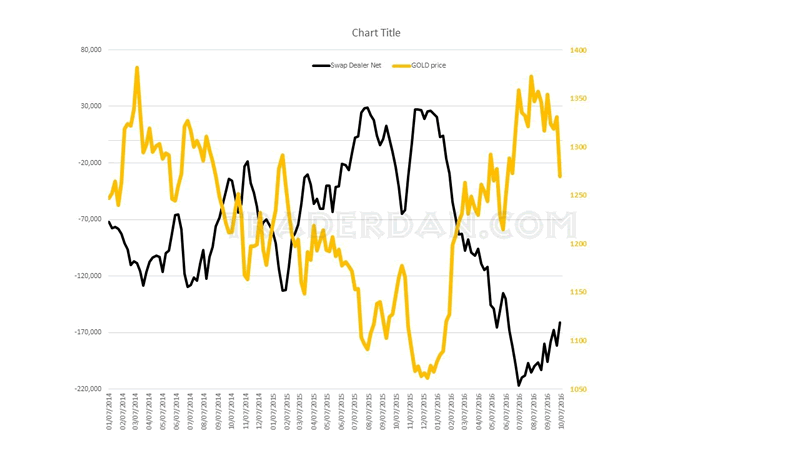
As is the pattern during these events, Swap Dealers and Commercials were busy covering short positions into the hedge fund selling.
The problem that I see for gold is the size of the net long position of the small traders, or the general public.
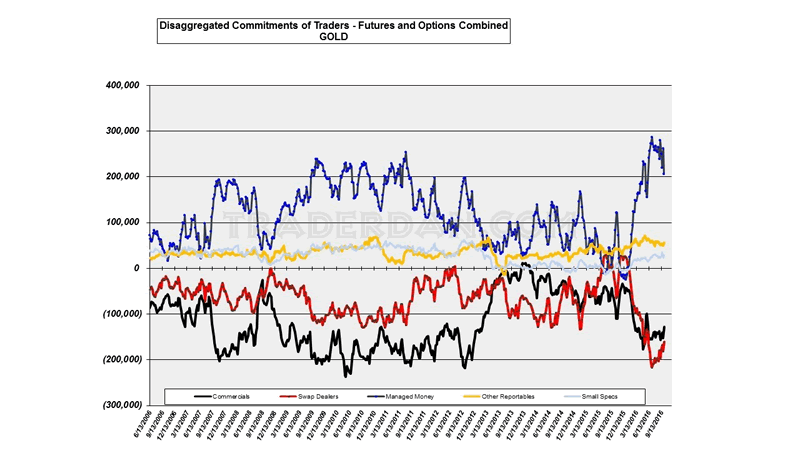
By a nearly 2:1 margin, they remain net long even after Tuesday’s sharp drop of some $42.
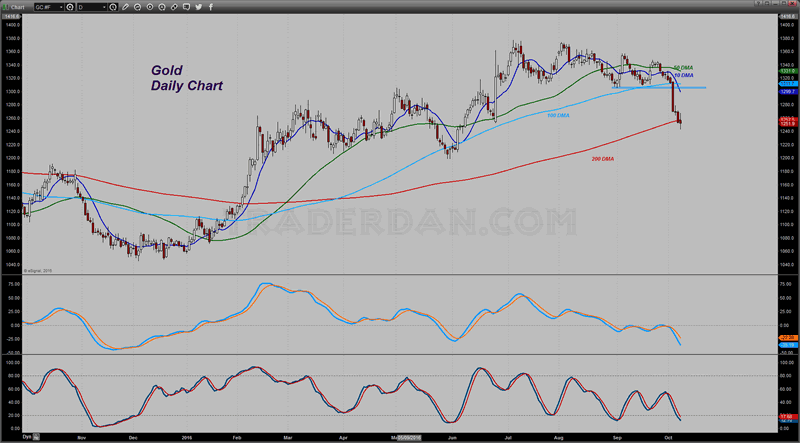
Those are weak hands. With the gold price now making two consecutive closes below its 200 day moving average, the technical picture has deteriorated significantly.
That June low is going to be the location of the battle for control of the market.
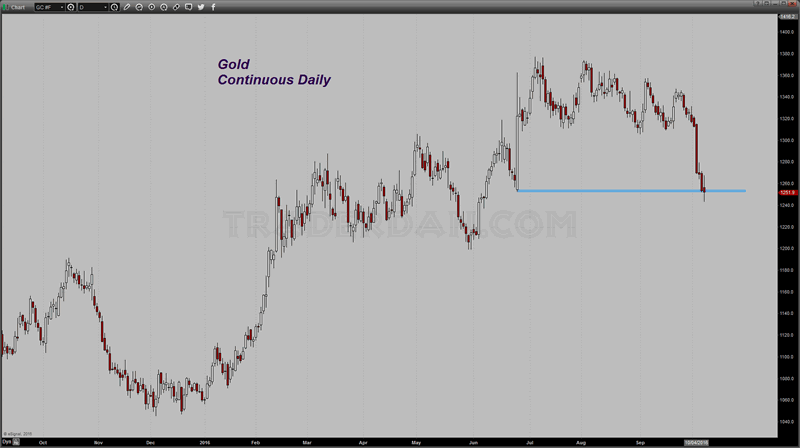
Price pushed down through that level and managed to close right at it for the purpose of the settlement price but I noticed that it did move higher later in the session and rebounded up to reach closer to $1258. Whether this rebound continues Sunday evening and into Monday morning remains to be seen; it could very well have been a round of short covering by shorts ringing the cash register after a very good week.
On the Heikin Ashi chart, you can see the chart remains in a negative posture. These charts are composed slightly different than your standard bar charts or candlestick charts but you can still see the significance of that June low. That low was formed on the day that gold staged an upside breakout above $1320 so you can rest assured all of those longs that bought in on that day near those lows are going to try to either defend those longs if they have the financial wherewithal to do so, or if they do not, hoping that their allies can rescue them.
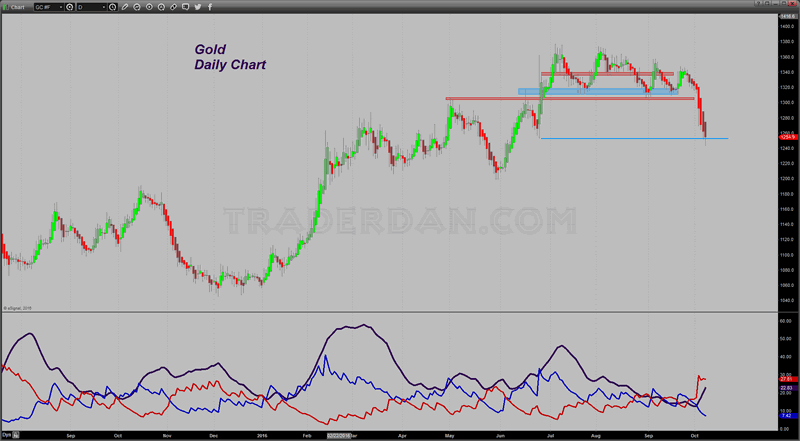
There is no doubt that a substantial number of margin calls are going out or have already gone out to those small specs.
There is one bright spot in this recent gold and gold-related debacle that I have seen however and that concerns the giant gold ETF, GLD.
It actually witnessed an 11 ton increase in reported gold holdings today. I must admit that I find this extremely odd given the deluge of selling that hit both the Comex gold futures this week and especially the mining shares.
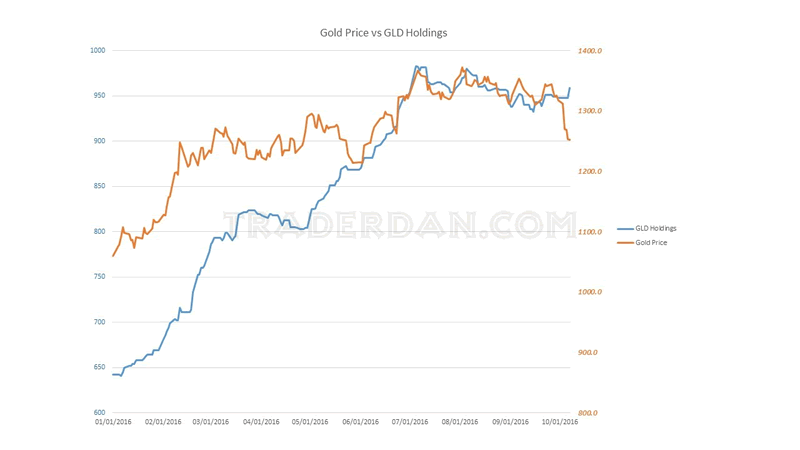
One does not often see the GLD holdings moving in the opposite direction to the gold price and the gold mining shares. That it did should offer some consolation to gold bulls as it shows that Western-based specs were interested in buying the metal over at the ETF even if the hedge funds were busy selling it over at the Comex.
One last chart for now… this is the HUI/Gold ratio. Close observers of this chart might have noticed that I LOWERED the line I had been watching. The previous level that I was monitoring was the low made in the ratio on September 1. That was crushed this week.
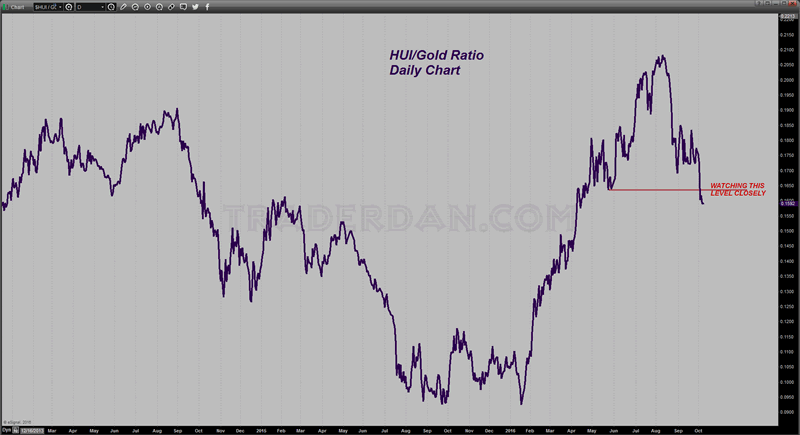
Now I am watching the May low in this ratio, which also cratered this week.
Why is that important? Because in looking at the chart of the HUI, the low made by the index was made that same month.
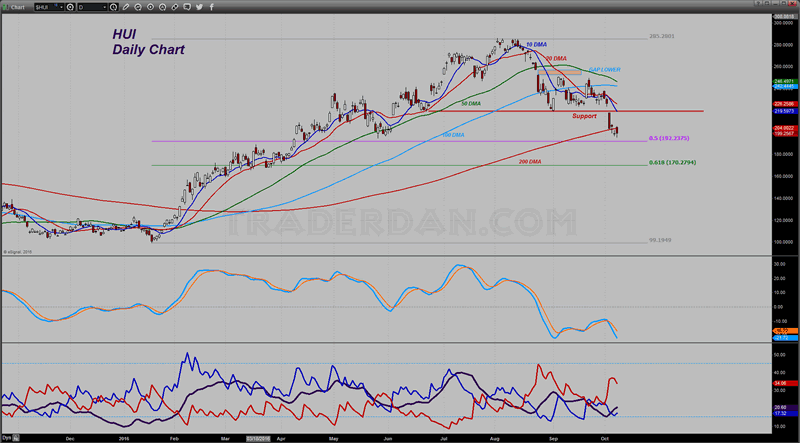
That low is under serious attack at the moment with the HUI having bounced off of it on Friday. If the ratio of the HUI to Gold could not hold, there is the real possibility that the index will not be able to hold those lows. This, plus the fact that the HUI also has now had two consecutive closes below its 200 moving average paints a rather sour picture technically of the longer term view by investors of the gold sector.
Bulls have their back to the wall and will need to perform next week to at least stabilize the damage and try to stem the bleeding. If they can keep the index above the May low, there is a chance the ratio could reverse higher. Perhaps the addition of those 11 tons to GLD will spur some buying early next week. We will have to wait and see but for now, I will feel much better about the mining share prospects if they can at least push it back above the 200 day.
A climb back above 220 will be needed to provide some glimmer of hope for the bulls.
Dan Norcini
Dan Norcini is a professional off-the-floor commodities trader bringing more than 25 years experience in the markets to provide a trader's insight and commentary on the day's price action. His editorial contributions and supporting technical analysis charts cover a broad range of tradable entities including the precious metals and foreign exchange markets as well as the broader commodity world including the grain and livestock markets. He is a frequent contributor to both Reuters and Dow Jones as a market analyst for the livestock sector and can be on occasion be found as a source in the Wall Street Journal's commodities section. Trader Dan has also been a regular contributor in the past at Jim Sinclair's JS Mineset and King News World as well as may other Precious Metals oriented websites.
Copyright © 2016 Dan Norcini - All Rights Reserved
All ideas, opinions, and/or forecasts, expressed or implied herein, are for informational purposes only and should not be construed as a recommendation to invest, trade, and/or speculate in the markets. Any investments, trades, and/or speculations made in light of the ideas, opinions, and/or forecasts, expressed or implied herein, are committed at your own risk, financial or otherwise. The information on this site has been prepared without regard to any particular investor’s investment objectives, financial situation, and needs. Accordingly, investors should not act on any information on this site without obtaining specific advice from their financial advisor. Past performance is no guarantee of future results.
Dan Norcini Archive |
© 2005-2022 http://www.MarketOracle.co.uk - The Market Oracle is a FREE Daily Financial Markets Analysis & Forecasting online publication.