


The Gold Price Rally is Finally Here!
Commodities / Gold and Silver 2018 Sep 09, 2018 - 01:16 PM GMTBy: Austin_Galt

 Pattern – price looks to have capitulated into a low at $1162 and I am now looking for price to trade down and set up a higher low.
Bollinger Bands – price fell just short of the upper band and is now back at the middle band which has been providing support. I expect this support to give way with price pushing into the lower band to set up the higher low.
Daily Chart
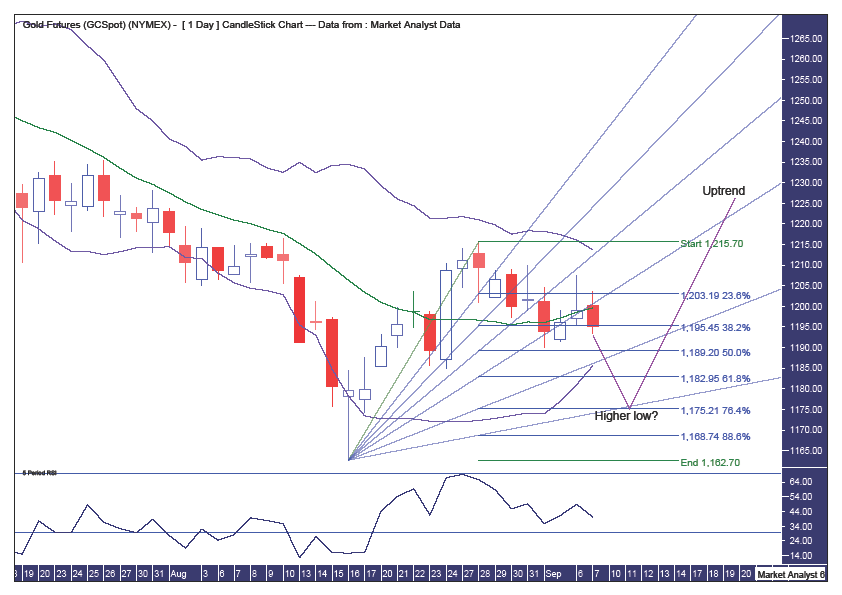
Fibonacci – I am targeting the higher low to be around support from the 88.6% angle and the 76.4% retracement level at $1175.
RSI – weak and should get down to around oversold territory before price turns back up.
Weekly Chart
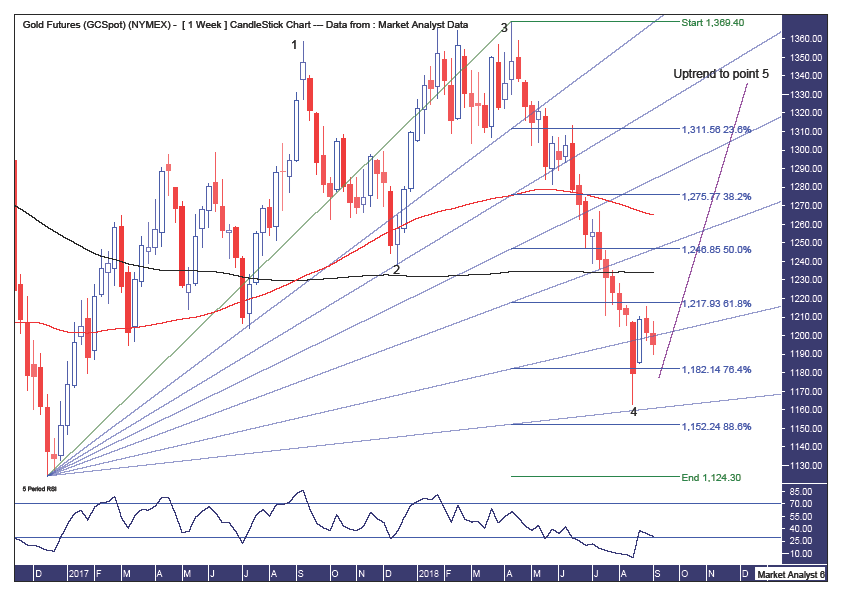
Pattern – I believe a 5 point broadening top is in play with points 1 to 4 now in place.
Fibonacci – I have been looking for each of the angles to provide support and bring in the low and it was the last area of real support in the 88.6% angle that looks to have seen in the low. Unbelievable. Actually, what is unbelievable is that I didn’t see this until the last moment. I often see these set ups a mile off. But there it is. Better late than never. The low was also nicely in between the 76.4% and 88.6% retracement levels which is always a good spot for a low to form.
Moving averages – in a bullish position and bulls would not be wrong to get a little excited about things are looking here.
RSI – has moved up out of oversold territory and is now threatening to get back in there. While it may during this coming week, I expect that by the time the week is over it will have turned back up. That implies I am looking for a drop into low before price reverses back up sharply by the end of the week.
Monthly Chart
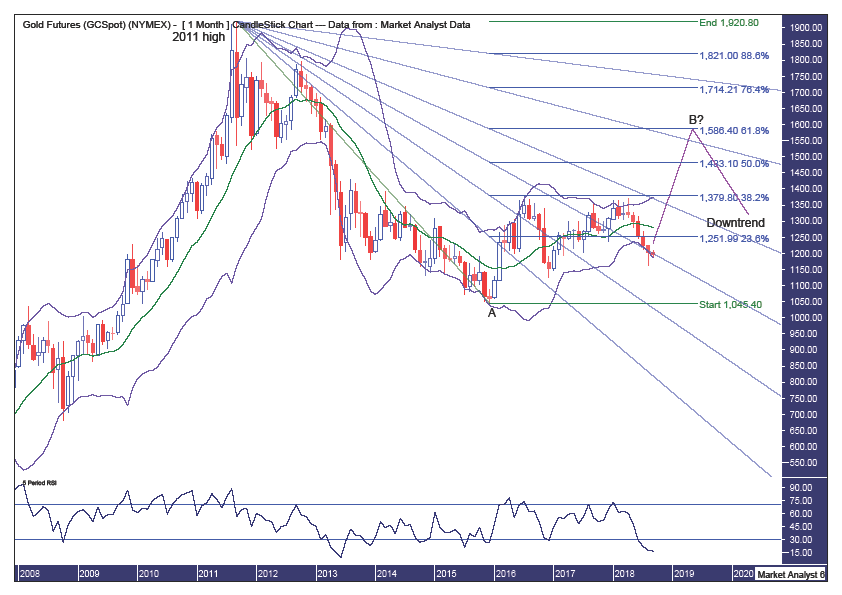
Pattern – I believe price is tracing out a big ABC correction with price still on its way to a wave B high. After that, I expect price to collapse to new lows.
Bollinger Bands – price is back at the lower band and I expect support to kick in big time here.
Fibonacci – price is at support from the 50% angle while I am ultimately targeting the wave B high to come in around resistance from the 76.4% angle and the 61.8% retracement level at $1586. Price may give each of these resistance areas a test before turning back down. That is, of course, if I have the overall outlook correct.
RSI – oversold.
Quarterly Chart
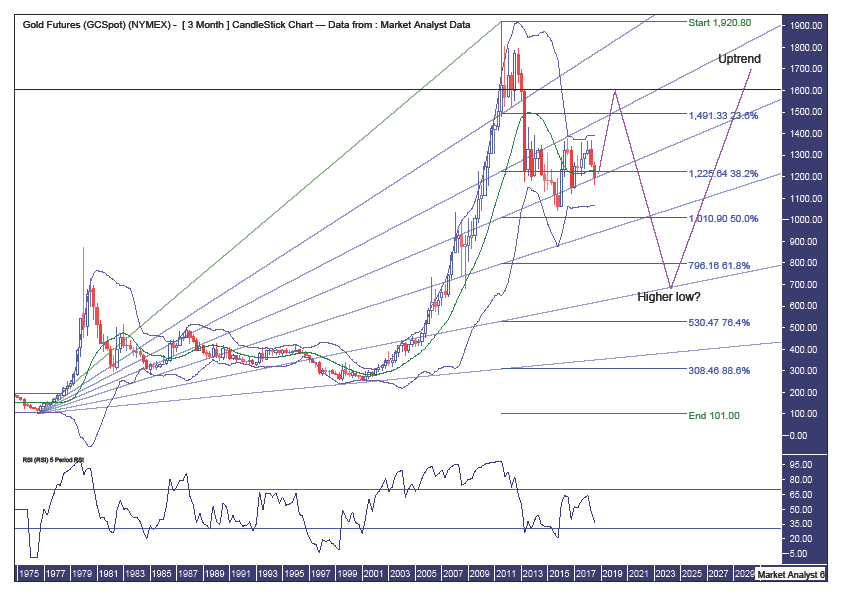
Pattern – while a massive bull trend is in progress, I believe a big correction is at hand with the coming expect rally to be a bear rally only.
Bollinger Bands – price is trading around the middle band and I expect big support to come in here and send price flying higher.
Fibonacci – I have drawn a fan from the 1976 low to all time high which shows some nice price symmetry with the 2001 low at retroactive support from the 88.6% angle while price has recently been consolidating between the 38.2% and 50% angles. Price is currently at support from the 50% angle and I expect a sharp rally that sees price get back up to the 38.2% angle a likely give that resistance angle a good test. After that, I expect price to collapse as we head into the next decade. Ultimately, I am targeting the wave C low, a higher low, to come in around support from the 76.4% angle while giving support from the 61.8% retracement level at $796 a good test. All in good time.
Horizontal line – denotes the level where price began to crash in 2013. Price often corrects back to the “scene of the crime” and I expect that to occur here. This level stands at $1602.
RSI – weak and should this outlook be wrong then this indicator will head down to oversold territory. That is not my expectation. Instead, I believe this indicator has just been passing time over the past two years and is now set to skyrocket up to around overbought territory.
Summing up – I expect a higher low to form in the coming days after which it will be all systems go for an explosive bear rally.
By Austin Galt
Austin Galt has previously worked as a stockbroker and investment banker while studying technical analysis for over two decades. He is also the author of the book White Night: A Colombian Odyssey
Email - info@thevoodooanalyst.com
© 2018 Copyright The Voodoo Analyst - All Rights Reserved
Disclaimer: The above is a matter of opinion provided for general information purposes only and is not intended as investment advice. Information and analysis above are derived from sources and utilising methods believed to be reliable, but we cannot accept responsibility for any losses you may incur as a result of this analysis. Individuals should consult with their personal financial advisors.
Austin Galt Archive |
© 2005-2022 http://www.MarketOracle.co.uk - The Market Oracle is a FREE Daily Financial Markets Analysis & Forecasting online publication.