


Chicago Fed Index Points To Weak GDP Report On Friday
Economics / US Housing Apr 24, 2007 - 12:20 PM GMTBy: Paul_L_Kasriel
 The Chicago Fed publishes a monthly national economic activity index (CFNAI). With the release of its March index today, we can now calculate an average for the first quarter. And that first quarter average is minus 0.30 - the lowest quarterly average reading since Q2:2003 and the third consecutive quarterly contraction in the CFNAI. All of this points to another quarter of subpar real GDP growth for the first quarter, which already is expected by the consensus of forecasters.
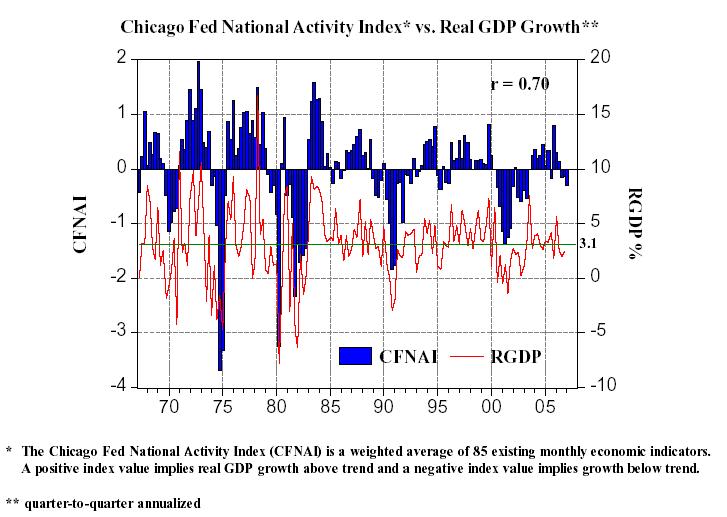
Before we go to the charts, let's give a little more explanatory detail about this undeservedly obscure index. The CFNAI is a weighted average of 85 existing monthly indicators of economic activity drawn from five broad categories: 1) output and income 2) employment, unemployment and hours 3) personal consumption, housing starts and sales 4) manufacturing and trade sales and 5) inventories and orders. This index is constructed to have an average value of zero and a standard deviation of one. Since economic activity tends toward trend growth rate over time, a positive index corresponds to growth above trend and a negative index corresponds to growth below trend .
Plotted in the chart below are the quarterly average values of the CFNAI and the quarter-toquarter annualized growth rates in real GDP. The compound average rate of growth in real GDP over the past 40 years is 3.1%, hence the horizontal line at that reading on the right-hand scale. The CFNAI is not a leading indicator of real GDP growth, but a coincident one. The contemporaneous correlation between the CFNAI and quarterly real GDP growth is 0.70 out of a maximum possible 1.00 - not too shabby. By eyeballing the chart, you, well, at least I, can see that when the CFNAI drops below zero, real GDP growth sure enough usually drops below 3.1%, as advertised.
Chart 1
The consensus forecast has real GDP growth accelerating in the second half of the year. Why should growth accelerate without some exogenous stimulus such as several Fed interest rate cuts? We see signs that the housing recession is starting to metastasize. Business capital spending is contracting. As Asha Bangalore mentioned last week, price-adjusted retail sales slowed to an annualized growth rate of 1.9% in the first quarter after having risen 11.2% in the fourth quarter (see Daily Global Commentary, April 17, 2007, Moderation of Core CPI Raises Probability of Fed Ease .) Asha also pointed out that the March level of real retail sales was below the firstquarter average, which implies a downward arithmetic bias to second quarter growth. And today, GM Vice Chairman Bob Lutz said the crisis in the mortgage market has hurt auto sales this month. Is the crisis in the mortgage market going to be over by next month?
By Paul Kasriel
The Northern Trust Company
Economic Research Department - Daily Global Commentary
Copyright © 2007 Paul Kasriel
Paul joined the economic research unit of The Northern Trust Company in 1986 as Vice President and Economist, being named Senior Vice President and Director of Economic Research in 2000. His economic and interest rate forecasts are used both internally and by clients. The accuracy of the Economic Research Department's forecasts has consistently been highly-ranked in the Blue Chip survey of about 50 forecasters over the years. To that point, Paul received the prestigious 2006 Lawrence R. Klein Award for having the most accurate economic forecast among the Blue Chip survey participants for the years 2002 through 2005.
The opinions expressed herein are those of the author and do not necessarily represent the views of The Northern Trust Company. The Northern Trust Company does not warrant the accuracy or completeness of information contained herein, such information is subject to change and is not intended to influence your investment decisions.
© 2005-2022 http://www.MarketOracle.co.uk - The Market Oracle is a FREE Daily Financial Markets Analysis & Forecasting online publication.