


Gold and Silver Trade Higher Within Technical Trend Channel
Commodities / Gold & Silver 2009 Feb 01, 2009 - 02:11 PM GMTBy: Merv_Burak

 Speculation is on the rise. Gambling stocks are on the move. PHLX Gold & Silver Sector Index weekly loss 1.5%. Merv's Gamb-Gold Index weekly gain 10.8%. Are we getting a little over heated here?
GOLD : LONG TERM - Since turning long term bullish in November the long term Point and Figure (P&F) chart has stayed on the bull side and continues its climb. The initial projection to the $930 level was reached this past week. What next? Well, going back a few years I still have that $1600 projection which has not yet been met.
I also still have a projection to the $1125 level based upon the lateral consolidation period of mid 2006 to mid 2007. It's interesting to note that once the price hits $945 I will be able to calculate a new projection, up to $1650, which is not that much different from my very long time $1600 calculation. Oh well, we'll just have to wait and see what transpires.
Looking over the daily chart and long term indicators everything looks rosy. Gold price is above its positive sloping moving average line, the momentum indicator is in its positive zone above its positive trigger line and the volume indicator, although not all that robust, is above its long term positive sloping trigger line. From all this the only long term rating I can give gold at this time is a BULLISH rating.
INTERMEDIATE TERM
Looking at an intermediate term version of the P&F chart (by changing the unit values of the chart) we see that we had the same break-out last November with a projection to the $930 level. Along the way the chart did reverse back to the down side but quickly corrected itself and continued higher. During this brief period when the action reversed and reversed again we had a lateral period on the chart which allowed me to make a new intermediate term projection. That one calculated to the $1030 level, which on the P&F chart was the top of the previous trend in March of 2008. So the way things stand with the P&F projections, I have an intermediate term projection to $1030, a long term projection to $1125 and a very long term one to the $1600 level. Others projections may come along as time progresses but we'll wait until they occur.
The intermediate term also looks all rosy for gold. The Friday action took gold into new closing high recovery territory. On a closing basis it is at its highest level since last July. The momentum indicator is also in its positive zone, above its positive trigger line and at new recovery highs. Another day or two of upside action and the momentum indicator will breach its highs of last July. The volume indicator, although positive, is sort of the laggard in these charts. It is moving higher and is above its positive sloping trigger line but is some distance yet from its July high. However, that does not affect its intermediate term rating, which is a BULLISH one.
SHORT TERM
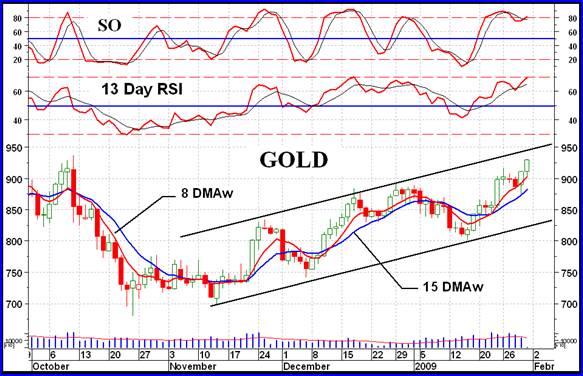
On the chart we see an intermediate term up trending channel that has trapped all of the short term moves since November. For it to continue there is very little upside to go before gold hits the upper resistance channel trend line. That should put a temporary halt to the gold move and allow it to once more relax and gain strength for its next move. As a warning that the rally may be coming to a temporary end, the momentum indicator is just about to enter its overbought zone. This is always a potential warning of a trend halt. The more aggressive Stochastic Oscillator had already entered its overbought zone but was possibly too soon. It's back into the zone once more. Despite the fact that we are getting to the point of a possible end of short term trend the indicators remain all positive and the short term rating remains BULLISH .
One would go with the up trend as the immediate term trend of least resistance but with the price so close to its upper resistance line I would be more inclined to go with a lateral move from here. Any up move might be short lived from here.
SILVER
I showed the silver P&F chart last week and the projection to $18.50. Silver tacked on another X in its upward move. Silver continues to out perform gold for the short and intermediate term but is still some distance from reaching gold's performance on the long term. On the short term (15 days) the rate of change for silver was 9.9% while for gold it was 6.4%. On the intermediate term (50 days) silver rate of change was 31.3% while for gold it was 23.2%. On the long term the rate of change in their prices was reversed. Silver had a negative 27.1% rate of change while gold had a positive 1.3%. So, silver, although acting better than gold for now still needs a lot better performance over the next several weeks if it is to catch up to gold's long term performance.
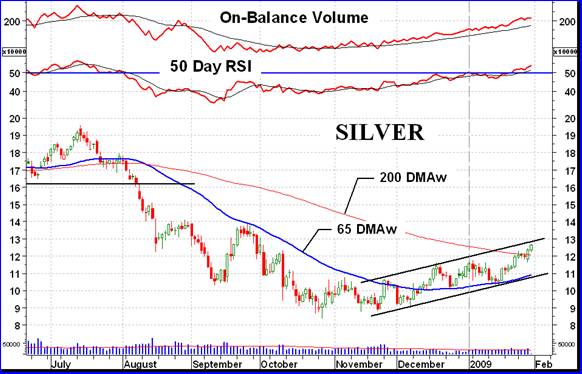
Everything on the chart looks good for silver from the intermediate term stand point. The price is nicely above its intermediate term positively sloping moving average line. The momentum indicator has now entered its positive zone above its positive trigger line and the volume indicator has been moving very nicely above its trigger line for some time now. Let's hope it continues like this although we know that there must be a rest period or short reaction sometimes ahead.
PRECIOUS METAL STOCKS
Although all of the major North American Gold Indices closed the week on the down side all of the Merv's Precious Metals Indices closed on the up side. The Merv's Gamb-Gold Index of 30 gambling variety of stocks had a very good week with a gain of 10.8%. The stock trading emphasis this past week seemed to be on the more speculative side of the stocks. This usually means that speculators are getting more comfortable with the idea that the stocks are in a new bull market and they are now going for the risky profits, which means the 10 baggers and the like. The big question is if their new found trust in the speculative is going to be short lived or if it actually will be the way of things for some time into the future.
To analyze where we are in the sphere of things I go to two separate locations. First is the easy, lazy location. That would be the Merv's Precious Metals Indices Table. In a matter of a few seconds, well let's say a minute, one can see what the various gold Indices are doing from the three main investment/speculative time periods. This tells us where these Indices are at this point in time. Good, but not what you want. My guess is that what most investors want is to know what will be happening TOMORROW and not what has happened yesterday. Unfortunately, I know of no analyst that can tell you that. Many may claim they know what will happen but in the end THAT is a decision of thousands upon thousands of individual investors, each making their judgment and the whole effect is then viewed as THE MARKET.
Be happy with what is and go with the flow. When the flow changes direction, you should change with it. The table included with the commentary has a set of technical indicators for the three time periods (short, intermediate and long term). Some of the commentaries do not include the short term information due to web posting constraints that I have not been able to resolve. When you understand that the technical information usually changes initially in the short term, then progresses to the intermediate term and finally some time later shows up in the long term you can develop methods of using these tables to judge when you should be buying, selling or just sitting around, depending upon your investment time horizon. In the SAMPLE section of the web site http://preciousmetalscentral.com there is a TUTORIAL that provides some beneficial suggestions for how to use the tables to your greatest advantage.
The second location I go to are the charts and indicators themselves. My analysis using the charts and indicators is similar to the suggestions in the mentioned TUTORIAL except that I may use different indicators when doing the analysis directly and may, at times, deviate from the outcome shown in the tables. The big difference between the table and my chart/indicator analysis would be in the long term period. I am still not fully into the bullish camp when viewing the indicators of the various Indices. The momentum indicators for the various Gold Indices are still in the negative zones although very close to their neutral lines. The Indices are mostly above their long term moving average lines but the slope of the moving average lines are still pointing downward. Most of the long term ratings are therefore in the + NEUTRAL category for the long term (versus POS in the tables). The other time periods are in agreement.
Merv's Precious Metals Indices Table
Well, that's it for another week.
By Merv Burak, CMT
Hudson Aero/Systems Inc.
Technical Information Group
for Merv's Precious Metals Central
For DAILY Uranium stock commentary and WEEKLY Uranium market update check out my new Technically Uranium with Merv blog at http://techuranium.blogspot.com .
During the day Merv practices his engineering profession as a Consulting Aerospace Engineer. Once the sun goes down and night descends upon the earth Merv dons his other hat as a Chartered Market Technician ( CMT ) and tries to decipher what's going on in the securities markets. As an underground surveyor in the gold mines of Canada 's Northwest Territories in his youth, Merv has a soft spot for the gold industry and has developed several Gold Indices reflecting different aspects of the industry. As a basically lazy individual Merv's driving focus is to KEEP IT SIMPLE .
To find out more about Merv's various Gold Indices and component stocks, please visit http://preciousmetalscentral.com . There you will find samples of the Indices and their component stocks plus other publications of interest to gold investors.
Before you invest, Always check your market timing with a Qualified Professional Market Technician
Merv Burak Archive |
© 2005-2022 http://www.MarketOracle.co.uk - The Market Oracle is a FREE Daily Financial Markets Analysis & Forecasting online publication.