


Stocks Bear Market Rally Slows The Bleeding
Stock-Markets / Stocks Bear Market Mar 04, 2009 - 03:29 PM GMT

 The bulls (and the shorts covering their positions) finally made a showing on Wall Street today. CNBC says that the reason for the bounce is that the Obama Administration announced its plan to provide relief to homeowners in distress as well as a stimulus plan being announced in China. That might not have hurt matters, but the real reason for the rally is that the market was extremely oversold. A positive day was bound to happen sooner rather than later.
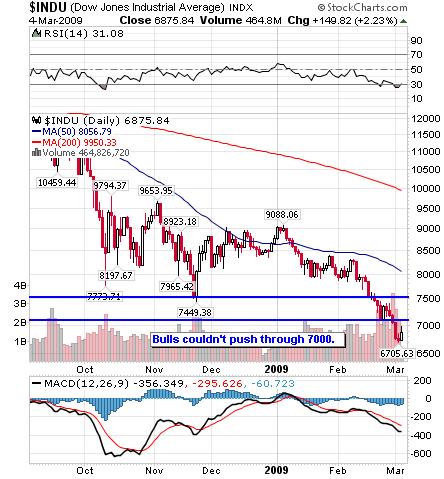
Unfortunately, I would not get too excited about Wednesday's action. The bulls not only could not push the DJIA back over 7000, but they backed down at the end of the day. This is not the type of action you want to see in the market.
The NASDAQ rally also petered out at the end of the day. This is not very promising material for a rally. Also , please take a look at the NASDAQ chart below:
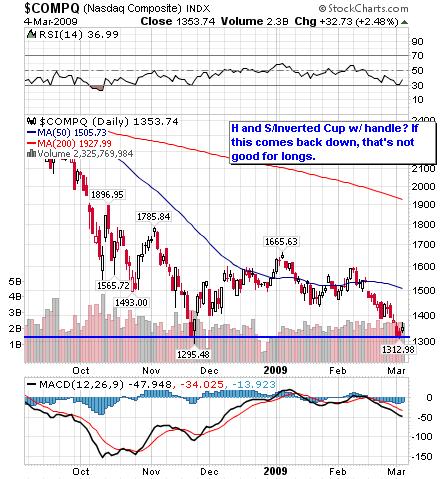
See the head and shoulders pattern (the left shoulder is in mid-December; the head is in January; and the right shoulder is in February)? As per Thomas Bulkowski , the head and shoulders pattern can sometimes occur as a continuation pattern. Here, the pattern would have confirmed when the neckline was breached at about 1450 or 1500 (it's not a text book pattern so you could draw the neckline in several places).
The other pattern that may be forming is an inverted cup with handle: The left brim would be the November low; the top of the cup would be the beginning of January; and the right brim would be the test of the low on Tuesday. What may be forming now is the handle. If the price comes back down to retest the low again it is highly likely that it will be breached.
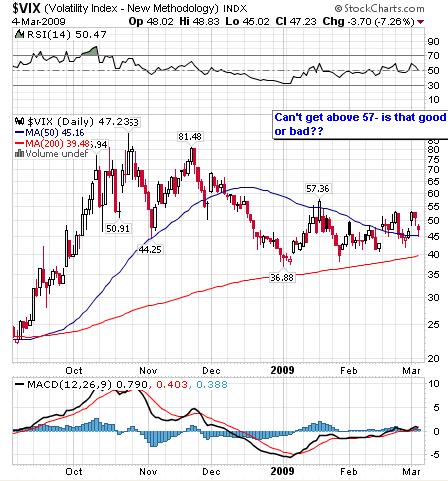
As can be imagined, investor sentiment is bearish. The VIX is at 47.23, indicating that fear was not as rampant as in November. What does that mean? One possibility is that this divergence is a positive sign. However, others have indicated that the VIX should rise as the market moves downward. Because fear, as indicated by the VIX , is not rising, these analysts are stating that things could get a lot worse before we need to reach the levels of capitulation reached in November. As I discussed in the past, when the VIX refuses to hit a new high when the indexes reach a new low, this results in divergence, which usually signals a turn. A divergence occurred between the VIX and the indexes in November and this past February when the markets made new lows. Unfortunately, that did not stop the market from heading downward.
Are you baffled by what is happening? Don't feel bad. You are in good company. There are quite a few technicians that are stepping away from their charts and indicators and scratching their heads. Things are so out of whack at this moment that no one can really make heads or tails of this market. So, if the “pros” can't make sense of the current conditions, don't worry- everyone else is just as confused. When that happens, the best thing to do is step aside and watch the show. There will be plenty of time to make money down the road.
By Kingsley Anderson
http://tradethebreakout.blogspot.com
Kingsley Anderson (pseudonym) is a long-time individual trader. When not analyzing stocks, he is an attorney at a large law firm. Prior to entering private practice, he served as a judge advocate in the U.S. Army for five years and continues to serve in the U.S. Army Reserves. Kingsley primarily relies on technical analysis to decipher the markets.
Kingsley's website is Trade The Breakout (http://tradethebreakout.blogspot.com)
Copyright © 2009 Kingsley Anderson - All Rights Reserved
Disclaimer: The above is a matter of opinion provided for general information purposes only and is not intended as investment advice. Information and analysis above are derived from sources and utilising methods believed to be reliable, but we cannot accept responsibility for any losses you may incur as a result of this analysis. Individuals should consult with their personal financial advisors.
Kingsley Anderson Archive |
© 2005-2022 http://www.MarketOracle.co.uk - The Market Oracle is a FREE Daily Financial Markets Analysis & Forecasting online publication.