


How My Charts Uncovered Two Big Stocks That Are Soaring Like Small Caps
Companies / Tech Stocks Sep 26, 2014 - 06:43 PM GMTBy: Money_Morning

 Michael A. Robinson writes: Each and every week I bring to you tech winners with great fundamentals.
However, perusing balance sheets and income statements isn’t the only way to find great stocks.
There’s also the technique known as technical analysis.
In technical analysis, we study a stock’s chart to figure out if it’s about to soar, ready to plummet or just treading water. And in my 30 years knocking around Silicon Valley, I’ve found that the stocks with the best charts tend to be small caps.
But not all stocks with eye-popping charts are risky small caps.
In fact, my charts have revealed two big-cap tech stocks with small-cap charts And today, I’m not only going to share these profit generators with you – I’m also going to give you a little DIY power by showing you how to decipher stock charts yourself…
Off the Charts
There’s a reason why popular small caps can have such great charts – at least for a time. It’s all about supply and demand.
Small caps, by definition, have fewer shares trading hands than big caps do. So, when investors jump into a trendy small cap because it has a hot new product out or a big bump in profits, the price rises quickly.
Big caps, on the other hand, have so many shares outstanding that even huge breakthroughs can have a muted impact on the stock price.
In our Sept. 19 conversation, I noted that underperforming small caps are the main reason the tech-centric Nasdaq Composite Index has recently fallen out of favor.
While that may be true, we usually focus on bigger tech companies here at Strategic Tech Investor, and I’ve uncovered several that are showing excellent technicals.
I’ve been fascinated with the visual display of data since just about forever. While I was earning my honors economics degree, I spent many, many hours drilling deep into supply and demand curves.
That background gave me the expertise I needed to create my own unique charting process. I call it the Real Demand Tracking System. As its name suggests, my system tells me about the real demand for a stock over any period I want to measure.
I use my Real Demand Tracking System regularly to help me find winning stocks for my premium trading service, Radical Technology Profits. While I subscribe to a professional charting service, I heavily customize it to improve my odds of finding big winners.
Today, however, I’m going to simplify technical analysis and use the free tools available at Yahoo Finance. It’s a fast and easy way to check a stock’s chart action.
And remember, we’re going backward today.
First, we’re going to look at the chart. Then, we’ll examine the fundamentals driving the stock. Finally, I’ll show you how you can create these same charts yourself.
Let’s get started:
Big Cap Stock With Small Cap Action No. 1: Microsoft
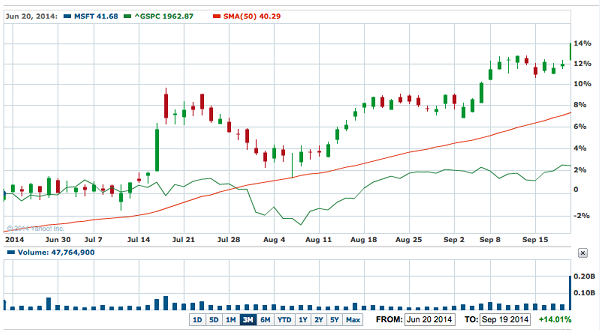
In fact, the price bounced off the 50-day line once in August and hasn’t looked back since this. That means when the price falls to its 10-week average, the bulls step in and buy en masse.
The wavy green line compares Microsoft to the Standard & Poor’s 500. Microsoft is just destroying the overall market and has done so for several weeks, beating it fivefold since late June.
Now then, let’s look at the fundamentals driving Microsoft these days. For one thing, the chart action is being driven by the fact that Microsoft has a new CEO, Satya Nadella.
Under Nadella, Microsoft is making huge strides. It recently acquired Nokia’s smartphone business, giving it a solid offering in the mobile revolution. According to the researchers at IDC, Windows Phone could add 80% to Microsoft’s mobile market share by 2018, when it will hit 6.4%.
The company also is making huge strides in another high-growth sector, cloud computing. Office 365 for that market now has an annual run rate of $4.4 billion. Sales in the most recent fiscal quarter rose 147% from a year earlier.
Thus, with Microsoft we see the global giant has a “small-cap chart” that is displaying a lot of positive momentum under its new CEO.
With a market cap of $381.09 billion, Microsoft trades at around $46 a share. It has operating margins of 32% and a return on equity of 26%. In its fiscal fourth quarter, operating income rose 6.7% to nearly $6.5 billion.
Big Cap Stock With Small Cap Action No. 2: Gilead
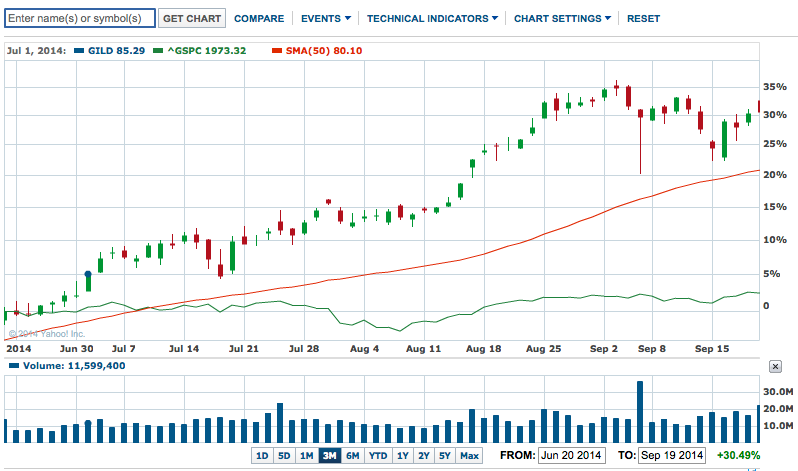
The chart for Gilead Sciences Inc. (NasdaqGS: GILD), also one of our favorites here, reveals to us another stock with strong bullish momentum. It’s up 30% in the past three months, compared with a 2.4% gain for the S&P 500 over the same period.
When we look at the price of Gilead against its 50-day moving average, we once again see a stock that the bulls are willing to support at this key trend line. The bears took a couple of hard runs at the stock, only to have the bulls step in and push prices higher.
That’s a sign of a very powerful stock. Yes, it’s slightly off its recent high but there is huge demand for Gilead, which we can clearly see in the chart.
Gilead also benefits from great fundamentals. Much of that hinges on the huge success of Sovaldi, a blockbuster drug used to cure the deadly disease hepatitis C.
During this year’s first quarter, Sovaldi had $2.3 billion in sales. To put that in perspective, that’s not only smashed analysts’ forecasts by some $1 billion but also is a record for a new drug.
But that’s not all. Sovaldi brought in $3.5 billion in second-quarter sales, for a six-month total of $5.8 billion. The drug’s smash success led Gilead in late July to double its revenue guidance to between $21 billion and $23 billion.
With a market cap of $162.37 billion, Gilead trades at around $108 a share. It has operating margins of 56% and a return on equity of 53%, and it grew earnings by 370% in the most recent quarter.
DIY Charts
To duplicate what I’ve done, go to Yahoo Finance and type the stock’s ticker symbol into the search bar. When the page for that stock shows up, click on “Interactive” under “Charts”on the left-hand side of the page.
To get candlestick patterns that make it easy to see price action, just select that under “Chart Settings/Line Type.” I prefer to use candlesticks because they’re highly visual and tell you the entire story of a day’s trading in a single pattern.
Here’s how you can see the stock’s underlying strength. You plot two lines that give you the 50-day moving average and also compare it to the S&P 500.
These two lines instantly tell us how well the stock is performing against the industry’s standard key support line, the 50-day moving average, and how it performs against the broad market.
To get the 50-day moving average, select “Simple Moving Average (SMA)” under “Technical Indicators.”For the S&P 500, select that under “Compare.“
Thus, you literally can “see” how and why Microsoft and Gilead are destroying the market – proving that the road to wealth is paved by tech. Each has strong technicals backed by solid fundamentals.
You have now learned some of the basics behind technical analysis. With a little practice, you’ll soon be reading charts like a pro and improving the timing of your investments.
That’s what we’re all about here at Strategic Tech Investor – not only sharing stocks with amazing profit potential, but also giving you the tools you need to greatly improve your net worth yourself.
Source : http://strategictechinvestor.com/2014/09/charts-uncovered-two-big-stocks-soaring-like-small-caps/
Money Morning/The Money Map Report
©2014 Monument Street Publishing. All Rights Reserved. Protected by copyright laws of the United States and international treaties. Any reproduction, copying, or redistribution (electronic or otherwise, including on the world wide web), of content from this website, in whole or in part, is strictly prohibited without the express written permission of Monument Street Publishing. 105 West Monument Street, Baltimore MD 21201, Email: customerservice@moneymorning.com
Disclaimer: Nothing published by Money Morning should be considered personalized investment advice. Although our employees may answer your general customer service questions, they are not licensed under securities laws to address your particular investment situation. No communication by our employees to you should be deemed as personalized investent advice. We expressly forbid our writers from having a financial interest in any security recommended to our readers. All of our employees and agents must wait 24 hours after on-line publication, or after the mailing of printed-only publication prior to following an initial recommendation. Any investments recommended by Money Morning should be made only after consulting with your investment advisor and only after reviewing the prospectus or financial statements of the company.
Money Morning Archive |
© 2005-2022 http://www.MarketOracle.co.uk - The Market Oracle is a FREE Daily Financial Markets Analysis & Forecasting online publication.