


S&P 500 Stock Market Index Must Bounce Here Or Hold On Tight!
Stock-Markets / Stock Markets 2019 Aug 26, 2019 - 07:54 PM GMTBy: Chris_Vermeulen

 The fragility of the markets can not be underestimated for investors at this time. Our research has continued to pick apart these price swings in the US stock markets and our July predictions regarding a market top and an August 19th (or near) breakdown price move have been SPOT ON. We’ve heard from hundreds of our members and followers regarding our research and predictive analysis work – many thanking us for our dedication to helping traders/investors. Some people, although, didn’t quite understand the message that we were trying to deliver.
So, in this message, we are going to try to make it very clear for everyone. But first, be sure to opt-in to our free market forecasts newsletter
First, we believe the US and Global markets are setting up for a broad price sell-off/reversion move. This means we believe the US and Global stock markets could move lower and contract by relatively large percent levels (15% to 25% or more) in the coming months.
Second, we believe this reversion process is related to a number of factors which we’ve highlighted in previous research posts. The US Presidential Election cycle (2020) is one factor. The continued US/China trade war is another factor. The slowing global economy is yet another factor, and the concerns regarding the EU, BREXIT and continuing global economic activity are yet more factors.
Third, every investor should be able to understand we have completed a massive phase in the global markets after the 2008 market crisis that includes the bottoming phase, the revaluation phase, the asset inflation phase, and the asset valuation maturity phase which we are currently in now. In other words, the past 9+ years has resulted in an incredible recovery process that is very mature at this time and full of overvalued assets throughout the globe.
Lastly, we believe the combination of these factors and the process of moving forward through the normal economic cycles related to a mature global asset valuation phase would result in a fairly common process of a “price reversion” which is an attempt to allow price to explore new lower levels to identify “true value” and for traders/investors to begin a new phase of price inflation.
We’ve been sharing one of our favorite price analysis tools with our followers, the Fibonacci price theory. This theory suggests that price MUST ALWAYS attempt to seek out new highs and/or new lows – AT ALL TIMES.
Think about that for a minute. If the price can’t move higher to seek out new highs (because of some fundamental or economic reason or event – like the end of a mature economic price inflation cycle), then what would price attempt to do?? That’s right – it would attempt to move lower and establish some new LOW PRICE level as a process of “revaluing” asset prices. This new “true value” level would allow the price inflation process to begin as the reversion in price would have washed away the concerns of price maturity/overvalued assets.
Now, as we attempt to move forward with our research, please understand that we believe the large downside price move last Friday is just the beginning of an extended setup and downside rotation that may take place over many months. Ultimately, we believe the end of September and into early October will be the most volatile for the US and global markets. Still, we have to deal with what is happening right now – before we get to the end of September and into early October.
If you have not seen our July 13th technical analysis talking about the week of Aug 19th for the stock market and vix be sure to read it now.
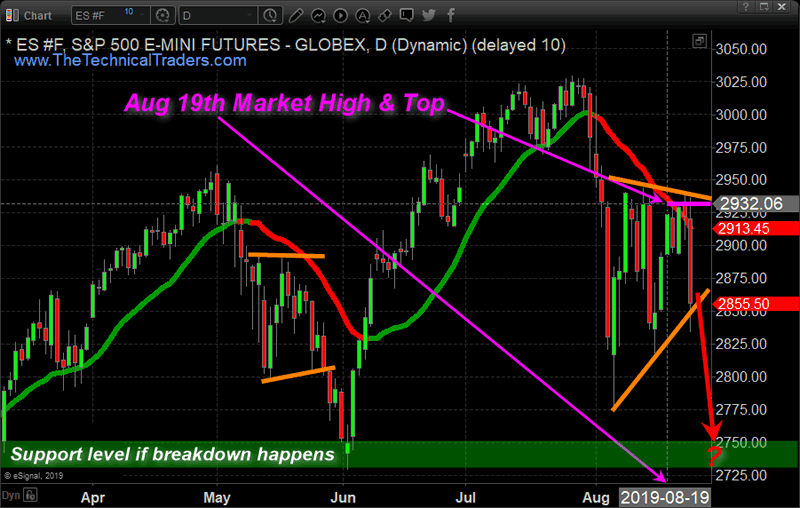
The Laymans Technical Trading Chart
The chart below shows a simple visual of what we expect over the next few days based on our technical trading tools and signals. IF you dig into the more detailed version using our ES Fibonacci modeling chart you will understand a lot more goes into this analysis, and there are several support levels we are watching.
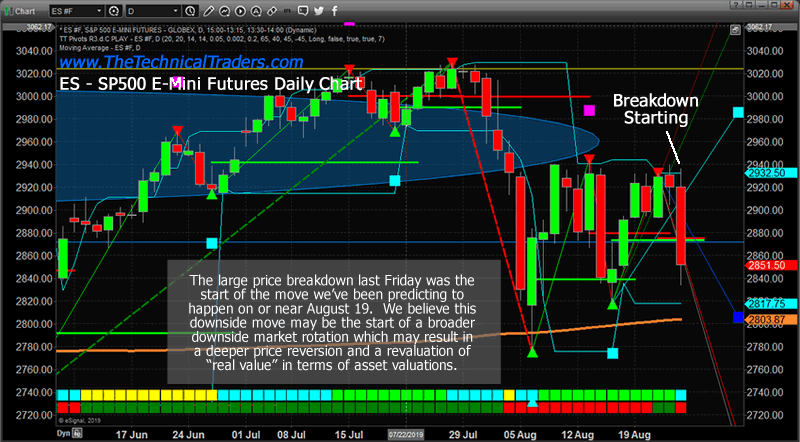
Daily ES Fibonacci Modeling Chart
This Daily ES Fibonacci modeling chart highlights the fact that the current Bearish Fibonacci Trigger level, near 2880, has been breached and downside target levels are 2685 and 2700. Obviously, the support level near the ORANGE MA (2800) is still a critical level for the price before we can consider the 2700 level any type of real target – yet we believe this breakdown move is not over. We believe support near 2780~2800 will still act as an immediate price floor and that price may stall near this level. The only exception to that support level would be some news-driven event taking place that pushes the price below that support level on very heavy volume. So, please understand, our expectation is that 2780 will be price support right now – but that support may be completely blown away on heavy selling based on critical news.
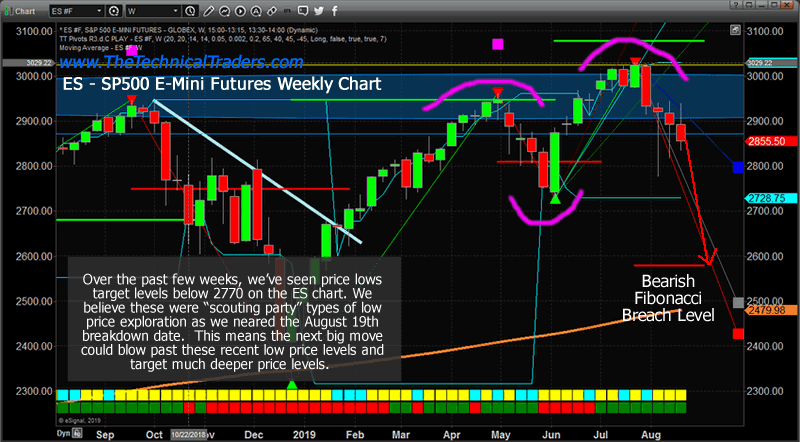
Weekly ES Fibonacci Price Modeling Chart
This Weekly ES Fibonacci Price Modeling chart shows a bigger picture of what we are expecting. The BLUE Fibonacci target square on this chart (just below 2800) is the current price support level. Notice how that level aligns with our earlier 2780 to 2800 support level? You’ll find that many times the Fibonacci price modeling tool is showing very similar analysis across different intervals because it attempts to dissect the core price elements that make up the Fibonacci price structures. Moving on…
The deeper Bearish Fibonacci Trigger level, near 2580, is critical. We will not enter a new confirmed Weekly Bearish trend until the price is able to CLOSE BELOW that level. So, we still have -300 points to move lower before we can potentially CONFIRM a new bearish price trend that could continue to move much lower before finding a bottom. This happens often in very volatile markets where price MUST move outside of existing price rotation levels to establish a new trend.
In Fibonacci price theory, and the way our Fibonacci price modeling system works, price must move clearly outside and away from existing recent price rotation levels (as the adaptive learning Fibonacci model tracks price) to qualify as a new trend. In this case, we still have a long way to go before we get true Bearish price confirmation on this Weekly chart.
We urge all traders to follow our research and posts so you have a better understanding of where the markets are within the short term, and long term trends and expectations. We understand you may not completely grasp some of these advanced tools and price modeling systems we use to analyze the markets and price trends.
Because of this and the fact that these market forecasts are not trading strategies joining our Wealth Building Newsletter for ETFs is the best way to be sure you take advantage of these moves without exposing your portfolio to high volatility and added risks.
We, honestly, don’t expect you to have gained the same level of understanding we have because we have been studying the markets and developing specialized tools based with our combined knowledge of 50+ years experience studying all types of price theories, technical analysis, and trading systems.
This experience and knowledge are what allows us to help you find and execute better trades, which is why our trading portfolio keeps making new all-time high watermarks even during this months market correction. We do the work, you profit from our ETF trading newsletter signals.
Chris Vermeulen
www.TheTechnicalTraders.com
Chris Vermeulen has been involved in the markets since 1997 and is the founder of Technical Traders Ltd. He is an internationally recognized technical analyst, trader, and is the author of the book: 7 Steps to Win With Logic
Through years of research, trading and helping individual traders around the world. He learned that many traders have great trading ideas, but they lack one thing, they struggle to execute trades in a systematic way for consistent results. Chris helps educate traders with a three-hour video course that can change your trading results for the better.
His mission is to help his clients boost their trading performance while reducing market exposure and portfolio volatility.
He is a regular speaker on HoweStreet.com, and the FinancialSurvivorNetwork radio shows. Chris was also featured on the cover of AmalgaTrader Magazine, and contributes articles to several leading financial hubs like MarketOracle.co.uk
Disclaimer: Nothing in this report should be construed as a solicitation to buy or sell any securities mentioned. Technical Traders Ltd., its owners and the author of this report are not registered broker-dealers or financial advisors. Before investing in any securities, you should consult with your financial advisor and a registered broker-dealer. Never make an investment based solely on what you read in an online or printed report, including this report, especially if the investment involves a small, thinly-traded company that isn’t well known. Technical Traders Ltd. and the author of this report has been paid by Cardiff Energy Corp. In addition, the author owns shares of Cardiff Energy Corp. and would also benefit from volume and price appreciation of its stock. The information provided here within should not be construed as a financial analysis but rather as an advertisement. The author’s views and opinions regarding the companies featured in reports are his own views and are based on information that he has researched independently and has received, which the author assumes to be reliable. Technical Traders Ltd. and the author of this report do not guarantee the accuracy, completeness, or usefulness of any content of this report, nor its fitness for any particular purpose. Lastly, the author does not guarantee that any of the companies mentioned in the reports will perform as expected, and any comparisons made to other companies may not be valid or come into effect.
Chris Vermeulen Archive |
© 2005-2022 http://www.MarketOracle.co.uk - The Market Oracle is a FREE Daily Financial Markets Analysis & Forecasting online publication.