Most Popular
1. It’s a New Macro, the Gold Market Knows It, But Dead Men Walking Do Not (yet)- Gary_Tanashian
2.Stock Market Presidential Election Cycle Seasonal Trend Analysis - Nadeem_Walayat
3. Bitcoin S&P Pattern - Nadeem_Walayat
4.Nvidia Blow Off Top - Flying High like the Phoenix too Close to the Sun - Nadeem_Walayat
4.U.S. financial market’s “Weimar phase” impact to your fiat and digital assets - Raymond_Matison
5. How to Profit from the Global Warming ClImate Change Mega Death Trend - Part1 - Nadeem_Walayat
7.Bitcoin Gravy Train Trend Forecast 2024 - - Nadeem_Walayat
8.The Bond Trade and Interest Rates - Nadeem_Walayat
9.It’s Easy to Scream Stocks Bubble! - Stephen_McBride
10.Fed’s Next Intertest Rate Move might not align with popular consensus - Richard_Mills
Last 7 days
All Measures to Combat Global Warming Are Smoke and Mirrors! - 18th Apr 24
Cisco Then vs. Nvidia Now - 18th Apr 24
Is the Biden Administration Trying To Destroy the Dollar? - 18th Apr 24
S&P Stock Market Trend Forecast to Dec 2024 - 16th Apr 24
No Deposit Bonuses: Boost Your Finances - 16th Apr 24
Global Warming ClImate Change Mega Death Trend - 8th Apr 24
Gold Is Rallying Again, But Silver Could Get REALLY Interesting - 8th Apr 24
Media Elite Belittle Inflation Struggles of Ordinary Americans - 8th Apr 24
Profit from the Roaring AI 2020's Tech Stocks Economic Boom - 8th Apr 24
Stock Market Election Year Five Nights at Freddy's - 7th Apr 24
It’s a New Macro, the Gold Market Knows It, But Dead Men Walking Do Not (yet)- 7th Apr 24
AI Revolution and NVDA: Why Tough Going May Be Ahead - 7th Apr 24
Hidden cost of US homeownership just saw its biggest spike in 5 years - 7th Apr 24
What Happens To Gold Price If The Fed Doesn’t Cut Rates? - 7th Apr 24
The Fed is becoming increasingly divided on interest rates - 7th Apr 24
The Evils of Paper Money Have no End - 7th Apr 24
Stock Market Presidential Election Cycle Seasonal Trend Analysis - 3rd Apr 24
Stock Market Presidential Election Cycle Seasonal Trend - 2nd Apr 24
Dow Stock Market Annual Percent Change Analysis 2024 - 2nd Apr 24
Bitcoin S&P Pattern - 31st Mar 24
S&P Stock Market Correlating Seasonal Swings - 31st Mar 24
S&P SEASONAL ANALYSIS - 31st Mar 24
Here's a Dirty Little Secret: Federal Reserve Monetary Policy Is Still Loose - 31st Mar 24
Tandem Chairman Paul Pester on Fintech, AI, and the Future of Banking in the UK - 31st Mar 24
Stock Market Volatility (VIX) - 25th Mar 24
Stock Market Investor Sentiment - 25th Mar 24
The Federal Reserve Didn't Do Anything But It Had Plenty to Say - 25th Mar 24

Market Oracle FREE Newsletter

How to Protect your Wealth by Investing in AI Tech Stocks

Overbought Bear Market Rally Expected to Sell off Strongly

Stock-Markets / Stocks Bear Market Apr 13, 2009 - 10:21 AM GMT

By: Guy_Lerner

Stock-Markets

Best Financial Markets Analysis ArticleAfter five weeks of "straight up" price action, the major indices and their ETF proxies are approaching key resistance levels.

Please review the methodology and the significance of the key price levels by clicking on this link.


A weekly cart of the S&P Depository Receipts (symbol: SPY) is shown in figure 1. The weekly close over the most immediate pivot low point at 82.61 will likely propel prices to the next key pivot at 86.78. This is about 1 point away from this past Thursday's close. The pivot at 86.78 represents significant resistance formed not only by the pivot but also by the down sloping trend line and the positive divergence bar (i.e., price bars marked in red). This level served as support for over 4 weeks back in December, 2008 and it was tested as resistance for four weeks in January, 2009 before breaking down in February. The market is currently over bought and investors are becoming increasingly bullish as prices approach this key level. Therefore, I have a hard time seeing the SPY breaking through these levels very easily. Over the next couple of weeks, I am anticipating selling pressure to resume here. If I am wrong, there will be a breakout, which should propel prices to the 40 week moving average.
Figure 1. SPY/ weekly


A weekly chart of the Diamond Trusts (symbol: DIA) is shown in figure 2. There is significant resistance at 82.61, which is less than 3% from current prices. This resistance level represents the prior break down point, and once again, within the context of the current sentiment and breadth picture, I am expecting selling and the market to stall at these levels. A breakout above the down sloping trend line would propel prices to the 40 week moving average.

Figure 2. DIA/ weekly


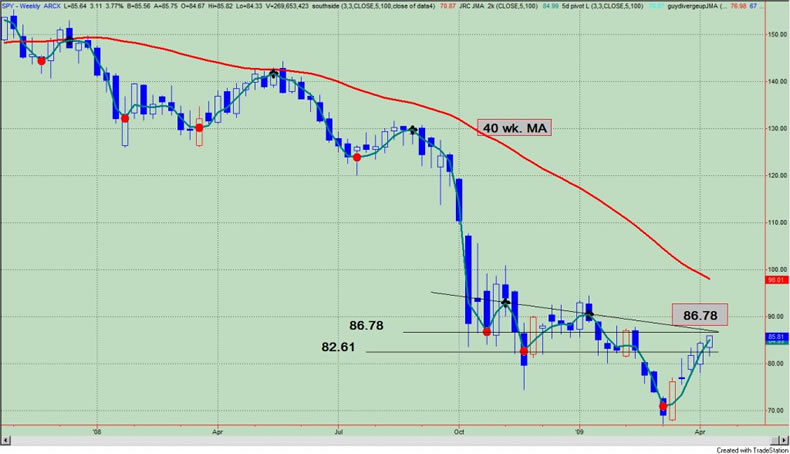
Figure 3 is a weekly chart of the Power Shares QQQ Trust (symbol: QQQQ). When I last wrote about the QQQQ on March 24 I stated: "The QQQQ is our best performer as prices have catapulted outside the upper channel line. A weekly close over the two upper pivots (at 30.33) would be considered a "breakout" in my book. The last "breakout" in early February was a fake out, but if this one "sticks", expect a melt up to $35 at the 40 week moving average."

I would say that we are on target for this to happen. 30.33 is now support, and I would expect selling pressure at the down sloping 40 week moving average.

Figure 3. QQQQ/ weekly


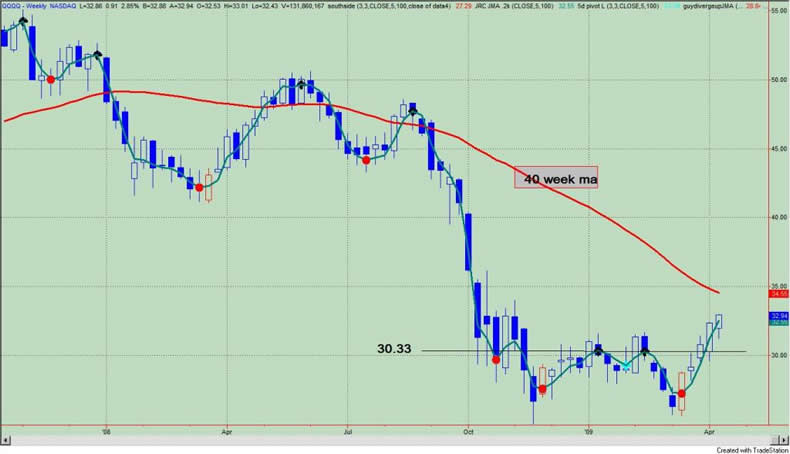
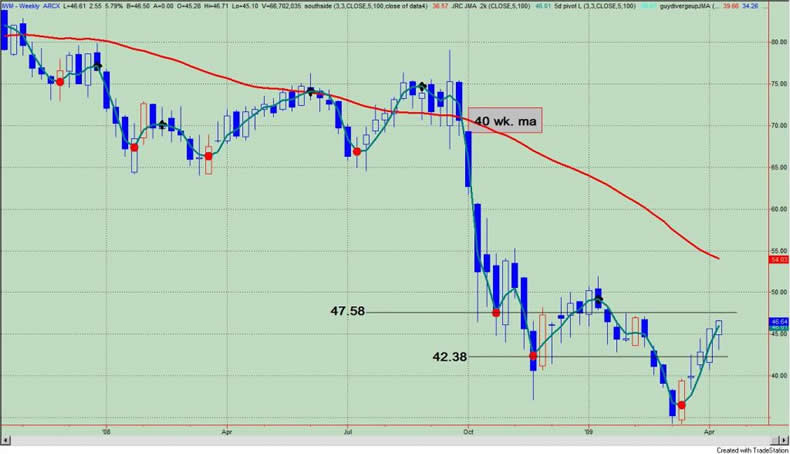
Figure 4 is a weekly chart of the i-Shares Russell 2000 Index (symbol: IWM). The close above the pivot at 42.38 will likely propel prices to the 47.58 level, which is about 1 point away from the recent close. There is significant resistance in this region - a key pivot point and 2 positive divergence bars. Like the SPY and DIA, I would expect selling. A weekly close above these levels would be significant and likely propel prices to the 40 week moving average.
Figure 4. IWM/ weekly

The over riding theme seems to be that key resistance levels are being approached just as investors are becoming more bullish and as the market is overbought. Overbought can always become more overbought and as we all know, it takes bulls to make a bull market. But within the context of the current bear market, I don't think this will happen just yet. I could be wrong. Nonetheless, I believe the market will require more time and will have to regroup at lower levels before successfully breaking through these resistance areas for good. If wrong, we will know, and we should expect prices to bolt to their 40 week moving averages.


By Guy Lerner

http://thetechnicaltakedotcom.blogspot.com/

Guy M. Lerner, MD is the founder of ARL Advisers, LLC and managing partner of ARL Investment Partners, L.P. Dr. Lerner utilizes a research driven approach to determine those factors which lead to sustainable moves in the markets. He has developed many proprietary tools and trading models in his quest to outperform. Over the past four years, Lerner has shared his innovative approach with the readers of RealMoney.com and TheStreet.com as a featured columnist. He has been a regular guest on the Money Man Radio Show, DEX-TV, routinely published in the some of the most widely-read financial publications and has been a marquee speaker at financial seminars around the world.

© 2009 Copyright Guy Lerner - All Rights Reserved
Disclaimer: The above is a matter of opinion provided for general information purposes only and is not intended as investment advice. Information and analysis above are derived from sources and utilising methods believed to be reliable, but we cannot accept responsibility for any losses you may incur as a result of this analysis. Individuals should consult with their personal financial advisors.

Guy Lerner Archive

© 2005-2022 http://www.MarketOracle.co.uk - The Market Oracle is a FREE Daily Financial Markets Analysis & Forecasting online publication.


Comments

Mark M
14 Apr 09, 08:10
Pivot Points

Thank you for your insightful technical analysis. One question, how do you determine your pivot points.

Mark M.


Mark M
14 Apr 09, 08:31
Charts

One additional question. when i blew up your charts to 500% it looks like you have a pivot point indicator. Can you tell me what charting service you use.

Thank you, Mark M


Post Comment

Only logged in users are allowed to post comments. Register/ Log in