Money Supply Multipliers, Velocity, and Excess Reserves
Economics / Money Supply Apr 27, 2009 - 12:10 PM GMTBy: Mike_Shedlock
 Inquiring minds are reading the Quarterly Review and Outlook by Van Hoisington and Dr. Lacy Hunt. It's an excellent report so let's take a look at some commentary and charts.
Record Expansion of the Fed's Balance Sheet and M2
In the past year, the Fed's balance sheet, as measured by the monetary base, has nearly doubled from $826 billion last March to $1.64 trillion, and potentially larger increases are indicated for the future. The increases already posted are far above the range of historical experience. Many observers believe that this is the equivalent to printing money, and that it is only a matter of time until significant inflation erupts. They recall Milton Friedman's famous quote that "inflation is always and everywhere a monetary phenomenon."
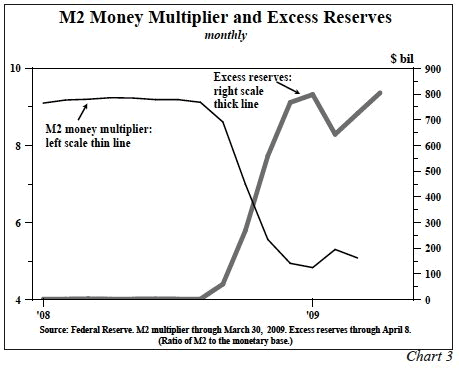
These gigantic increases in the monetary base (or the Fed's balance sheet) and M2, however, have not led to the creation of fresh credit or economic growth. The reason is that M2 is not determined by the monetary base alone, and GDP is not solely determined by M2. M2 is also determined by factors the Fed does not control. These include the public's preference for checking accounts versus their preference for holding currency or time and saving deposits and the bank's needs for excess reserves. These factors, beyond the Fed's control, determine what is known as the money multiplier. M2 is equal to the base times the money multiplier.Over the past year total reserves, now 50% of the monetary base, increased by about $736 billion, but excess reserves went up by nearly as much, or about $722 billion, causing the money multiplier to fall (Chart 3). Thus, only $14 billion, or a paltry 1.9% of the massive increase of total reserves, was available to make loans and investments. Not surprisingly, from December to March, bank loans fell 5.4% annualized. Moreover, in the three months ended March, bank credit plus commercial paper posted a record decline.
Hoisington is correct that the Fed is not in control. However, the statement "Thus, only $14 billion, or a paltry 1.9% of the massive increase of total reserves, was available to make loans and investments" places the cart in front of the horse.
The money is available to lend in theory (It's not really for reasons we will get to in a moment) but banks simply do not want to lend as the pool of credit worthy borrowers is shrinking. Moreover consumers and corporate borrowers are showing a huge demand for dollars (a reluctance to borrow and spend).
Excess reserves are rising because of the increased demand for money and because banks are preparing in advance for future writeoffs, not because the increased demand for money means there is less money to lend. It's important to place the horse in front of the cart.
Nonetheless, it's important to note that "from December to March, bank loans fell 5.4% annualized. Moreover, in the three months ended March, bank credit plus commercial paper posted a record decline."
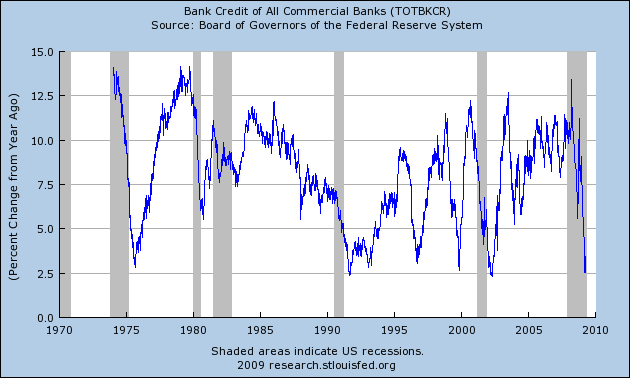
Total Bank Credit
While not yet negative, total bank credit is plunging. Now conceptualize what that chart would look like if banks marked that credit to market (my preferred way of looking at things). No doubt that chart would be deep into negative territory.
We do not know the full extent of what that chart would look like with credit marked to market because banks are playing games with level 3 assets, hiding bad debts in off balance sheet SIVs, and otherwise pretending that many loans that will never be paid, will be paid back.
Factors Affecting Banks Unwillingness To Lend
- Rising unemployment will cause ...
- Rising credit card defaults
- Rising home equity loan defaults
- Rising mortgage loan defaults
- Rising commercial loan defaults
On top of that there is an increased demand for money by cash starved boomers headed into retirement who finally realize they do not have enough savings.
Excess Reserve Mirage
Factor all of upcoming defaults and much of those so called Excess Reserves are pure fantasy!
Is it any wonder banks are reluctant to lend? The irony in this situation is that bank lending is the most responsible it has been in a decade, and neither the Fed nor Congress is happy about it.
With that let's return to the article with and discussion about M2 and Velocity.
What about the M2 Surge?
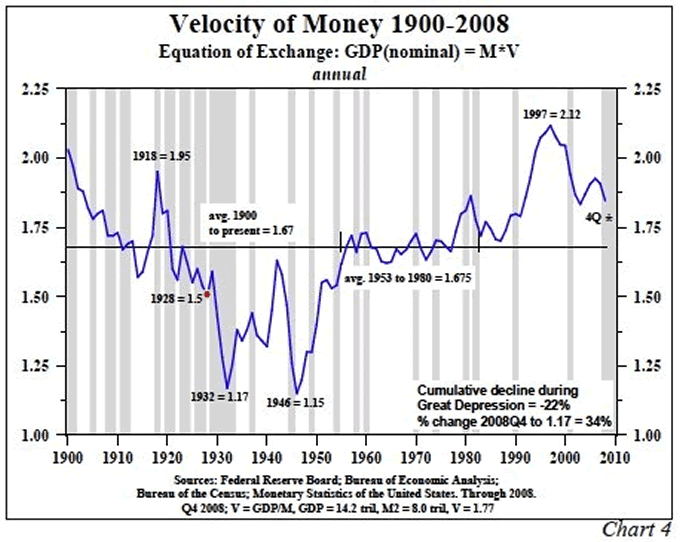
M2 has increased by over a 14% annual rate over the past six months, which is in the vicinity of past record growth rates. Liquidity creation or destruction, in the broadest sense, has two components. The first is influenced by the Fed and its allies in the banking system, and the second is outside the banking system in what is often referred to as the shadow banking system. The equation of exchange (GDP equals M2 multiplied by the velocity of money or V) captures this relationship.
The statement that all the Fed has to do is print money in order to restore prosperity is not substantiated by history or theory. An increase in the stock of money will only lead to a higher GDP if V, or velocity, is stable. V should be thought of conceptually rather than mechanically. If the stock of money is $1 trillion and total spending is $2 trillion, then V is 2. If spending rises to $3 trillion and M2 is unchanged, velocity then jumps to 3. While V cannot be observed without utilizing GDP and M, this does not mean that the properties of V cannot be understood and analyzed.

The highly ingenious monetary policy devices developed by the Bernanke Fed may prevent the calamitous events associated with the debt deflation of the Great Depression, but they do not restore the economy to health quickly or easily. The problem for the Fed is that it does not control velocity or the money created outside the banking system.
In regards to velocity it is important to understand that falling velocity does not cause anything to happen. Falling velocity is a result of two phenomena.
1. Increased demand for money
2. Undertaking projects that make no economic sense (i.e. there is negative cost benefit payback).
Most government sponsored work efforts have a negative payback as do the various "ingenious monetary policy devices developed by the Bernanke Fed", as did the lending practices of Fannie Mae, etc.
Moreover those "highly ingenious monetary policy devices" are guaranteed to prolong the recovery process if not make the ultimate calamity worse. This is what happened when Japan tried the same measures.
Let's return once again to Hoisington.
Japan Government Debt vs. Economic Recovery
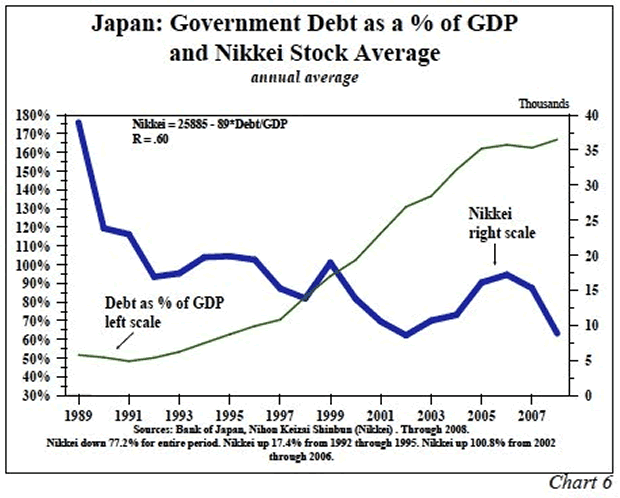
By weakening the private economy, government borrowing is not an inflationary threat. Much light on this matter can be shed by examining Japan from 1988 to the 2008 and the U.S. from 1929 to 1941. In the case of Japan government debt to GDP ratio surged from 50% to almost 170%. So, if large increases in government debt were the key to economic prosperity, Japan would be in the greatest boom of all time. Instead, their economy is in shambles. After two decades of repeated disappointments, Japan is in the midst of its worst recession since the end of World War II. In the fourth quarter, their GDP declined almost twice as fast as that of the U.S. or the EU. The huge increase in Japanese government debt was created when it provided funds to salvage failing banks, insurance and other companies, plus transitory tax relief and make-work projects.
In 2008, after two decades of massive debt increases, the Nikkei 225 average was 77% lower than in 1989, and the yield on long Japanese Government Bonds was less than 1.5% (Chart 6). As the Government Debt to GDP ratio surged, interest rates and stock prices fell, reflecting the negative consequences of the transfer of financial resources from the private to the public sector (Chart 7). Thus, the fiscal largesse did not restore Japan to prosperity. The deprivation of private sector funds suggested that these policy actions served to impede, rather than facilitate, economic activity.

Other than an occasional putting the cart in front of the horse syndrome, this was an excellent read by Van Hoisington and Dr. Lacy Hunt. It's well worth a complete review.
By Mike "Mish" Shedlock
http://globaleconomicanalysis.blogspot.com
Click Here To Scroll Thru My Recent Post List
Mike Shedlock / Mish is a registered investment advisor representative for SitkaPacific Capital Management . Sitka Pacific is an asset management firm whose goal is strong performance and low volatility, regardless of market direction.
Visit Sitka Pacific's Account Management Page to learn more about wealth management and capital preservation strategies of Sitka Pacific.
I do weekly podcasts every Thursday on HoweStreet and a brief 7 minute segment on Saturday on CKNW AM 980 in Vancouver.
When not writing about stocks or the economy I spends a great deal of time on photography and in the garden. I have over 80 magazine and book cover credits. Some of my Wisconsin and gardening images can be seen at MichaelShedlock.com .
© 2009 Mike Shedlock, All Rights Reserved
Mike Shedlock Archive |
© 2005-2022 http://www.MarketOracle.co.uk - The Market Oracle is a FREE Daily Financial Markets Analysis & Forecasting online publication.


