Crude Oil to Underperform Metals
Commodities / Crude Oil May 15, 2009 - 07:20 PM GMTBy: Ashraf_Laidi
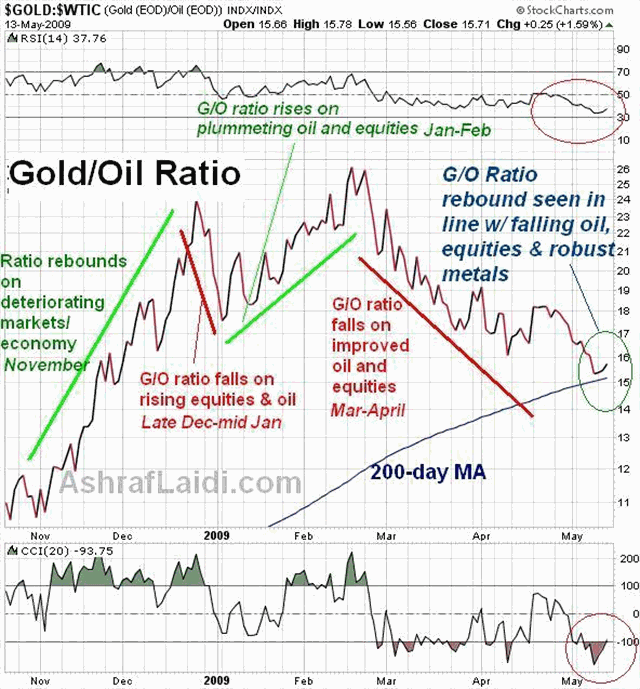
 While both oil and equity indices reveal preliminary signs of a consolidation, downward momentum is particularly expected to weigh on oil. This is especially supported by my expectation for oil prices to underperform metals, which is signalled by a looming rebound in the Gold/Oil ratio. The chart below cogently illustrates how the turning points in the Gold/Oil ratio are driven by commodity markets' optimism with the economy.
Thus, a rising G/O ratio occurs during deteriorating sentiment (expressed primarily by oil weakness) while a falling G/O ratio emerges in tandem with improved market sentiment. And despite the decline in the G/O ratio from its 14-year highs attained in February, it continued to hold above its 200-day MA, which hasn't been broken since last fall.

Notably, the "green shoots" theme of the past 8 weeks unleashed substantial gains in oil prices (+60% from Feb lows), which outweighed the recovery in gold (+12% from Jan lows), silver (+24% from Jan lows) and copper (+47% from Jan lows). Accordingly, the Gold/Oil ratio fell 37% its February highs of 26.0. And with equity indices due for prolonged pullback (macropicture does not justify stocks further nearing to fair value) and the prospects for another govt-driven boost for banks in Q2 diminishing, risk aversion trades are set to re-emerge in favour of metals (led by silver), the yen, the dollar (to lesser extent than yen)all at the expense of equities and energy prices.
Readers of our March 13 piece Here Comes the 2-Month Cycle recall how we predicted the bear market rally would last for 2 months. If equities stick to this 2-month pattern (as they have since March 2008), then we could be on the cusp of a fresh downleg into late Q2.
Oil technicals suggest an initial target of $54 by early next week, followed by $51.80, with any attempts for a rebound seen limited at $57.80. We reiterate our positive outlook for gold and silver from last week's piece, backed by the notion of a potential win-win situation for gold, silver and copper whereby: (i) any further gains in equities would fuel metals on improved global risk appetite (what's good for China & the green shoots theory is good for metals) and; (ii) any pullback in equities (and banks) could fuel the rotation from financials into metals and ETFs. Technically, each of the last 3 attempts by gold to break below its 200-day MA has failed over the past 4 weeks. $935 appeared as the initial target for gold, followed by $975. A clear break of $1,100 isn't seen until end of Q2.
Despite falling risk appetite over the past days, the dollars stabilization has paled compared to the rebound in the yen as the US currency has yet to shake off the concerns of soaring bond yields, contracting economy and recent remarks by Japanese politicians calling for the halt of treasury purchases (although those sounded like only political posturing by the leader of the opposition party). Canadian dollar seems well past its moment in the sun and is set for further retreat, with USDCAD targeting at 1.1850, followed by 1.1910-- the 200-day MA. The sell-oil story remains a fundamental driver as technicals show gradual signs of a breakdown, eyeing $54.60 as the next key target.
Chapter 6 of my book Currency Trading & Intermarket Analysis devotes in- depth analysis of the historical implications of the Gold/Oil ratio since 1971, clearly highlighting how the turnarounds from the cyclical lows (and highs) were highly predictive of economic turnarounds and shifts in the Feds interest rate policy.
By Ashraf Laidi
AshrafLaidi.com
Ashraf Laidi is the Chief FX Analyst at CMC Markets NA. This publication is intended to be used for information purposes only and does not constitute investment advice. CMC Markets (US) LLC is registered as a Futures Commission Merchant with the Commodity Futures Trading Commission and is a member of the National Futures Association.
Ashraf Laidi Archive |
© 2005-2022 http://www.MarketOracle.co.uk - The Market Oracle is a FREE Daily Financial Markets Analysis & Forecasting online publication.


