


A Look at Pan American Silver (PAAS) and The Silver Stock Sector
Commodities / Gold & Silver Stocks Jun 05, 2007 - 01:34 AM GMTBy: Clif_Droke
 It has been a rough past few weeks for the silver stocks, with some taking more of a hit than others. A few “name” stocks like Coeur d'Alene (CDE) have born the full brunt of the bears' fury while other stocks have held up quite well and some have even gone on to make new highs in spite of the recent correction. We'll take a look at some of these stocks in this report.
Pan American Silver (PAAS) closed up 1.73% on Monday to end the session at $29.35. PAAS finally closed above its 60-day and 90-day moving averages in the daily chart as seen below. The fact that the 90-day MA is still rising reflects the lingering upside momentum PAAS still enjoys. Recently there has been some question as to whether this residual momentum is strong enough to lift PAAS back up to test its April high in the face of falling silver stock sector internal momentum. You can now see some hope for PAAS in the immediate term based on the action of the past couple of trading sessions. A test of the $31.00 area is a very good possibility before PAAS encounters strong resistance.
The silver stock internal momentum for the overall sector has been very choppy of late, as alluded to in an earlier report. Take a look at the dominant interim momentum indicators for the silver stock group (SS HILMO) shown below. The 30-day indicator (dark blue line) is on the verge of crossing into negative territory, not a good sign. The 60-day through 120-day indicators don't look too hot either. Yet the dominant 200-day indicator looks superb and based on my rate of change projections should even go higher from here.
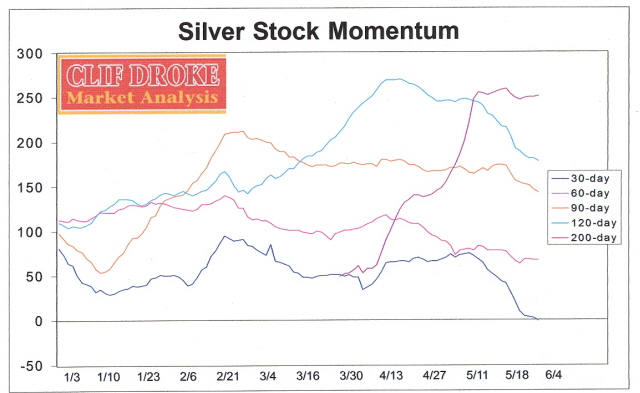
So how do we interpret these extreme cross-currents? With dominant 200-day momentum in the silver stock group still bullish, it favors the overall sector finding support and remaining relatively buoyant for now despite recent selling pressure from last month and in spite of some of those bearish-looking H&S patterns that some analysts have been alluding to in the charts of some high-profile individual silver stocks. Remember, chart patterns alone aren't of much value until you consider the internal momentum situation which is the market backdrop. With a strong momentum backdrop, even the most bearish looking pattern can turn to the upside.
One of the silver stocks with what appeared at first glance to be a bearish H&S pattern in its daily chart is Silver Wheaton (SLW). Actually, the fundamental and relative strength backdrop for SLW isn't bad at all in spite of the near term overhead supply SLW has had to contend with recently. Some chart analysts looked at the daily chart of SLW and concluded that it would break down imminently below the $10.50 “neckline” support (which is also where the rising 60-day and 90-day moving averages happen to converge in the daily chart). Yet SLW has so far confounded the skeptics and is on the verge of completely invalidating the H&S pattern. Another example of why chart pattern alone can't always be trusted.
Right now we don't have the strongest internal momentum backdrop I've ever seen, but it's good enough to provide some support and to allow some technical rallies among many of the silvers. The ones that should most especially benefit are the ones that are already close to their highs for the year and still in confirmed uptrends, such as Endeavor Silver (EDR:TSX) and Silver Standard Resources (SSRI). Several of the actively traded silver stocks still have rising 90-day moving averages, which indicates residual upside momentum in spite of the April-May correction.
Another consideration for the silver stocks is how many are currently “oversold” and could use a relief rally from here. There are still quite a few of these in the sector, including Tara Gold Resources (TRGD) and ECU Silver (ECU:TSXV). Also worth mentioning is that the leading indicator stocks for the silver mining sector are still in decent shape. These include Freeport Copper & Gold (FCX), Inmet Mining (IMN:TSX) and Platinum Group Metals (PTM:TSX).
All in all, the indicators are saying it's too early to give up on the silver stocks in spite of some extreme cross-currents within the group and in spite of some questionable chart patterns. The 200-day internal momentum for the group is still up strongly and so are the 90-day moving averages for many of the actively traded silvers, which reflects “external” momentum.
By Clif Droke
www.clifdroke.com
Clif Droke is editor of the daily Durban Deep/XAU Report which covers South African, U.S. and Canadian gold and silver mining equities and forecasts PM trends, short- and intermediate-term, using unique proprietary analytical methods and internal momentum analysis. He is also the author of numerous books, including "Stock Trading with Moving Averages." For more information visit www.clifdroke.com
© 2005-2022 http://www.MarketOracle.co.uk - The Market Oracle is a FREE Daily Financial Markets Analysis & Forecasting online publication.