


Japanese Yen, JPY Moving Higher
Currencies / Japanese Yen Jul 08, 2009 - 05:06 AM GMTBy: Frederic_Simons

 After having remained in a seemingly directionless trading range within the last few weeks, the price of the Japanese Yen is currently behaving in a bullish way, as evidenced by its rising prices in the last days (rising prices in the Japanese Yen Future are mirrored by falling prices in USD/JPY).
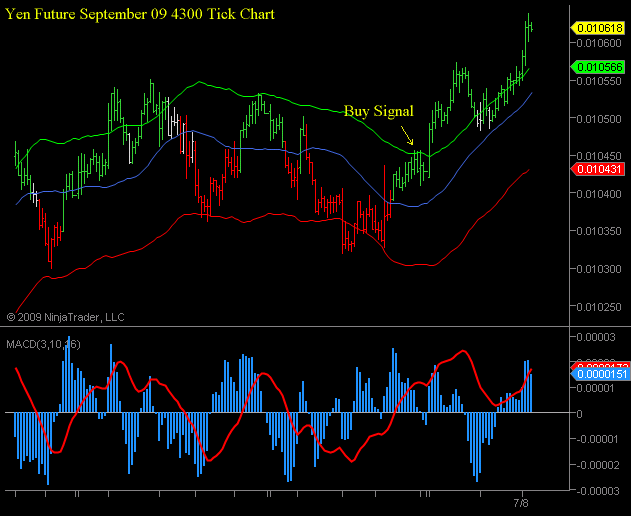
In our last Japanese Yen Market Update (please click here to access), we noticed that our proprietary algorithms had issued a buy signal on the Japanese Yen September 09 Future.
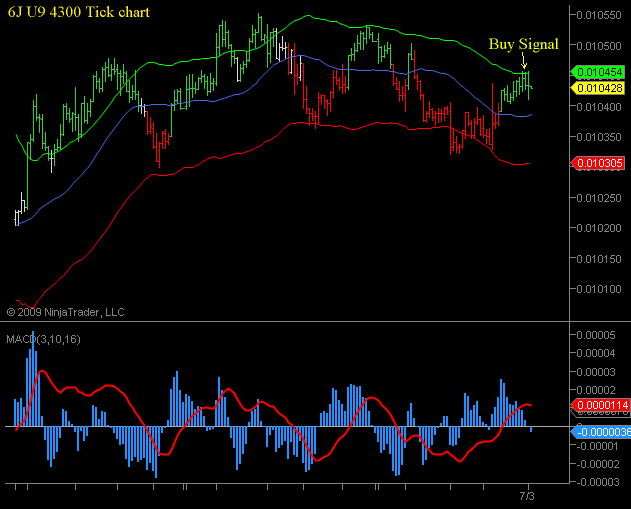
As you might have seen from previous market comments by Crossroads FX (click here for past newsletters), we use an approach that bases trade decisions on the actual behaviour of the price, not on fundamental aspects. For this purpose, we developed a proprietary indicator that finds out the line of least resistance both to the downside and to the upside, and prints them on the chart as a green line (buy line) and a red line (sell line). You can see on the following charts that if the price trades for 2 consecutive bars above the green line, rising prices are to be expected. Once the price trades for 2 bars below the red line, you should prepare for falling prices.
The chart we published on July 3rd was looking as follows:
Since then, prices have moved higher without looking back, as you can see in the updated 4300 Tick Chart:
The big picture 300min chart is also looking very bullish currently. Prices are currently trading well above the green buy-line, showing that the line of least resistance is clearly to the upside:
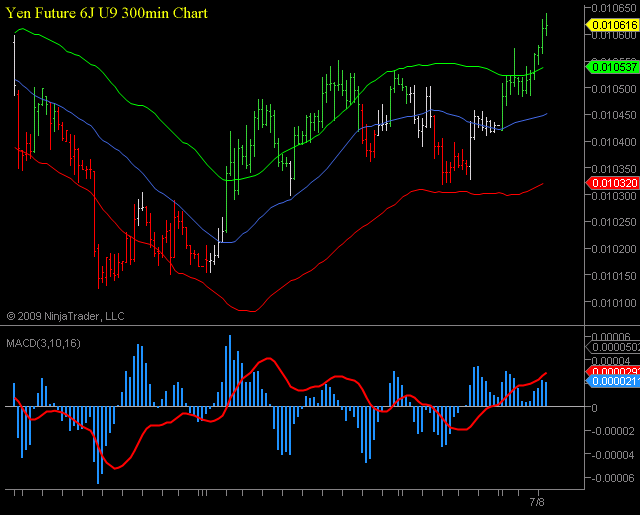
You can see on the charts above that the red sell-line is at 0.010431 on the shorter term 4300 Tick chart, and at 0.010320 on the 300mn chart. This means that it would take prices to trade for 2 consecutive bars below these levels to endanger the current strong uptrend in the respective time frame. For the moment however, there is little reason to assume this will happen within the near future.
As a conclusion, the line of least resistance points to even higher prices in the Japanese Yen (lower Prices in USD/JPY), and recent price action offers good reason for being a Japanese Yen Bull for now.
If you have any questions, please do not hesitate to contact us by writing an email to

By Frederic Simons
http://www.crossroadsfx.hostoi.com
© 2009 Copyright Frederic Simons - All Rights Reserved
Disclaimer: The above is a matter of opinion provided for general information purposes only and is not intended as investment advice. Information and analysis above are derived from sources and utilising methods believed to be reliable, but we cannot accept responsibility for any losses you may incur as a result of this analysis. Individuals should consult with their personal financial advisors.
© 2005-2022 http://www.MarketOracle.co.uk - The Market Oracle is a FREE Daily Financial Markets Analysis & Forecasting online publication.
Comments
|
Paul
11 Jul 09, 11:52 |
YEN
how long will the yen remain in a bullish mode ? |