


Gold and Silver Downside Breakout Trend Consequences Analysis
Commodities / Gold & Silver 2009 Jul 12, 2009 - 05:28 AM GMTBy: Merv_Burak

 It seems to have been almost all down hill since I last posted my commentary two weeks ago. Gold and silver bullion as well as stocks have broken on the down side but there is still some life left. Let’s get at today’s assessment.
GOLD - LONG TERM
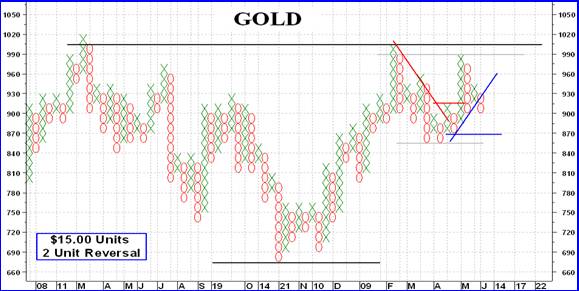
Before getting into the weekly commentary, some comments on the head and shoulder pattern. I have had several readers who have pointed out reverse head and shoulder patterns in gold, one a long term and one of an intermediate term basis. I believe there have been some experts that have shown the same pattern recently. I had shown a long term gold chart in my commentary for the week ending 19 June 2008. You can find it in the archives of many of these sites and it might better show the patterns discussed. The long term reverse head and shoulder pattern, as suggested to me, has the shoulders on the left and right sides of this chart with the reverse head in the middle. As for the intermediate term pattern, the left and right shoulders can be seen on the right side of the chart with the reverse head in the middle. Unfortunately, I DO NOT subscribe to these being reverse head and shoulder patterns. They are more legitimately potential double top patterns which I had talked about previously.
Head and shoulder patterns are trend reversal patterns and therefore for a reverse head and shoulder to be present (suggesting an upside break) you would have had to have had a bear market move leading into the pattern. For a normal head and shoulder the lead in trend would have been a bull market trend. In neither of these cases do we have a bear market leading into the formation of the pattern and therefore we DO NOT have a reverse head and shoulder pattern.
The long term P&F chart suggests that we are still in a bull market and some distance away from a reversal. With the existing pattern that reversal would come if the move should go straight down to the $870 level breaking below the blue line and two previous lows.
As for the normal indicators, they too have still not reversed. Although the price of gold is still some distance above a simple 200 day moving average line I use the weighted method which gives a more aggressive line. The price of gold is still above this line but only barely. The moving average line is, however, still in a positive slope. The long term momentum indicator remains in its positive territory but is moving lower and is below its negative sloping trigger line. The volume indicator has now crossed below its long term trigger line although the trigger remains in an upward slope. So, what does all this mean? It means that the long term rating remains BULLISH but is getting close to being down graded if the negative gold price trend continues much longer.
INTERMEDIATE TERM
In my last commentary the price of gold had just climbed above its intermediate term moving average line. Unfortunately, it quickly reversed and broke below the line in a decisive manner and is now below its previous recent low and well on its way downward. The momentum indicator has also moved into its negative zone and below its negative trigger line. As for the volume indicator, it too is below its negative sloping trigger line. All in all, the intermediate term rating is BEARISH.
SHORT TERM
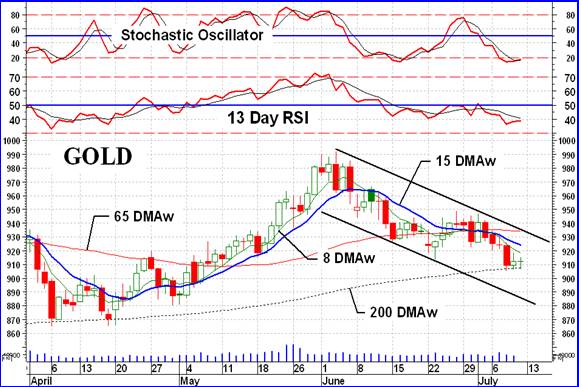
The recent trend in the price of gold is easy to see on a short term chart. Everything here is on the down side. The action appears to be trapped inside a downward trending channel. The price is below its negative sloping moving average line and the momentum is in its negative zone below its trigger line. Both indicators have moved below recent lows. The very short term moving average line remains below the short term line for confirmation of trend. Everything points to a still BEARISH short term rating.
As for the immediate direction of least resistance, well the aggressive Stochastic Oscillator is giving us some hope for a reversal of short term trend, at least for a little while. It is still in its oversold zone but has moved above its trigger line and might be heading to breach its oversold line. Although this is not necessarily a sign of a reversal of trend it is a sign that the existing trend may be running out of steam and needs a reversal or at least a rest period (such as the period following June 15th). I will go with the lateral trend as the one with least resistance for now.
SILVER
What goes up the mostest comes down the fastest. Silver just can’t seem to get its act together and continues to act a lot worse than gold lately. While gold lost 1.8% of its price during this past week silver lost 5.5% of its price. Although it is still acting slightly better than gold over the intermediate and long term, over the past short term the performance of silver puts it in spot 22 out of 24 off the components in the Precious Metals Indices Table. Only the S&P Gold Index and the Merv’s Qual-Silver Index had a worse short term performance.
Since its recent top in early June the trend in silver price has been almost straight down. It is heading towards a reasonable support just below the $12 level. Should it hit $11.50 then most likely it will continue down to test the previous low at the $8.50 to $9.00 level.
Looking through the various indicators silver is now BEARISH for all three time periods.
PRECIOUS METAL STOCKS
Most precious metal (gold and silver) stocks took a deep hit this past week. Average losses, based upon Index declines, were in the order of 6% to 10%. This has put all stock Indices into the BEARISH camp on the short and intermediate term. Many Indices have also gone BEARISH on the long term but there still are some hold outs like the Merv’s Gold & Silver 160 Index, the Penny Arcade Index and the Spec-Silver Index which still maintain their BULLISH long term ratings. The Merv’s new Penny Arcade Index is probably holding up the best, especially when measured relative to its recent gains. It is still up 402% from its Nov low even after a 21.5% decline from its early June high.
There is no way of knowing when this latest decline in the stocks will end. We can guess, intelligently or otherwise, but no one REALLY knows. One must assume that a decline, once established, will continue. For this reason probably the best policy to protect one’s capital, is to start looking for exits in individual stocks. When the turn around comes, tomorrow or next year, you will be sitting with cash to take advantage of the new move. If you don’t exit from your losing stocks, and the decline continues, you do not get a second chance. You could eventually break even on the next bull move but that may be 100’s of % points from where the stock might bottom out prior to a reversal.
In my view it is always better to err on the side of protecting your capital rather than to err on the side of an ego refusing to see the possibility of any major decline.
PRECIOUS METALS INDICES TABLE
Well, that will be it for this week.
By Merv Burak, CMT
Hudson Aero/Systems Inc.
Technical Information Group
for Merv's Precious Metals Central
For DAILY Uranium stock commentary and WEEKLY Uranium market update check out my new Technically Uranium with Merv blog at http://techuranium.blogspot.com .
During the day Merv practices his engineering profession as a Consulting Aerospace Engineer. Once the sun goes down and night descends upon the earth Merv dons his other hat as a Chartered Market Technician ( CMT ) and tries to decipher what's going on in the securities markets. As an underground surveyor in the gold mines of Canada 's Northwest Territories in his youth, Merv has a soft spot for the gold industry and has developed several Gold Indices reflecting different aspects of the industry. As a basically lazy individual Merv's driving focus is to KEEP IT SIMPLE .
To find out more about Merv's various Gold Indices and component stocks, please visit http://preciousmetalscentral.com . There you will find samples of the Indices and their component stocks plus other publications of interest to gold investors.
Before you invest, Always check your market timing with a Qualified Professional Market Technician
Merv Burak Archive |
© 2005-2022 http://www.MarketOracle.co.uk - The Market Oracle is a FREE Daily Financial Markets Analysis & Forecasting online publication.