


Seven Myths About Gold Debunked, Bubble Bursting Warning Target $600?
Commodities / Gold & Silver 2009 Jul 20, 2009 - 07:03 AM GMTBy: Andrew_Butter

 A bubble is when prices gets distorted from fundamentals by speculation, fear, market manipulation...etc; they are different from cycles which are the natural trade-off and re-adjustment of supply and demand; the difference is that bubbles pop (The Seven Immutable Laws of Bubbles: Example, Housing Markets in USA, UK & Duba). The problem with understanding gold is it's hard to work out the fundamentals, which explains why there are so many myths about it.
Myth#1: The price of gold correlates with CPI in USA:
That gold long-term is a hedge against inflation is undisputed; legend has it that a toga in Ancient Rome cost about the same in gold as a suit today. But I just saw a special offer at a Savile Row tailor for suits that were priced at £2,000 last year, going for £500. So if the "toga" theory is correct, gold should now be worth a quarter of what it was worth last year, like $250? And that's not counting the fall of the pound/dollar exchange rate.
But then any self-respecting economist can explain how it is, that although now the price of just about everything is going through the floor, that is not "Deflation" that is "Disinflation", and they will tell you, anyway. that's not "core". One question, if we take (a) food, (b) gasoline, (c) housing, (d) automobiles, (e) clothing, and (f) computers out of the CPI calculation (the cost of all of those are going down)...is there anything left?
Here is a chart of the price of gold (annual average) against the US CPI Deflator:
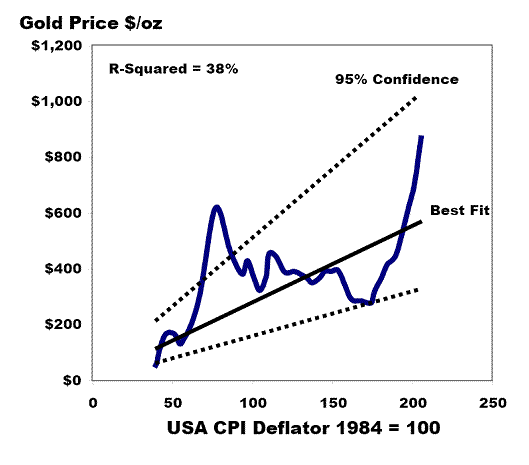
That is not a good correlation; what it proves is that based on current published CPI numbers there is a 95% chance that the price of gold should be somewhere between $300 and $1,200 (and a 5% chance it will be outside that range).
That's not very helpful; sure long term perhaps, but there is something wrong with that comparison, although it probably proves that the new idea that's floating around in some quarters that gold protects against inflation AND deflation, (the universal protector against all things bad), is unlikely.
All it really proves is that either over the past thirty-five years or so gold was massively mispriced from time to time (some people say there was a conspiracy), or there was something massively wrong with the CPI numbers (more on that later).
Myth#2: Long Term Gold has been a fantastic investment.
This is a plot of the price of gold (annual averages) compared to the S&P 500 and housing in USA since it was "liberated" from the gold standard in 1971.
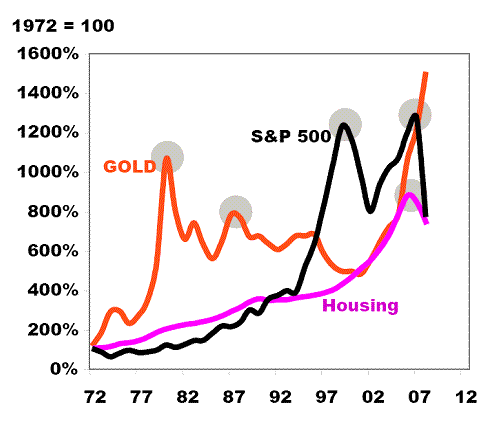
That's not strictly a "fair" comparison because if you had stocks you would have got dividends, and if you had a house you could have rented it or saved on the cost of renting, whereas if you had gold it would have cost about 1% a year to store it.
But just for illustration, if you bought gold in 2000 you would have more than tripled your money, if you bought stocks then you would be down 40%. If you bought gold in 1980 you would have watched it slowly slide to about half by 2000.
It depends on your perspective; like they say, investments can go up and they can go down, trick is of course to buy at the bottom and sell at the top.
Myth #3: Gold does not have bubbles and busts:
The little gray circles on the chart are bubbles and busts. Since Gold got liberated from the gold standard in 1971 it has had two bubbles and busts, so did the S&P 500; housing (in USA) has had one (commercial property had two and UK housing had three).
I can't help wondering...isn't it the "season"?
Myth#4: Technical Analysis warns of bubbles popping (and the "technical" for gold is great)!
I trawled through of articles leading up to the recent stock market crash, very few said "Grab your money and run a mile", at least until it was too late.
I'm not trying to score points; but as far as I understand, that analysis predicts where the herd is likely to head, short-term. Well you can predict where a herd of lemmings is going to go next, ninety-nine times out of a hundred, but that says nothing about when they are all going to jump off a cliff.
The latest survey of analysts by Reuters confirmed that none of the analysts think this lemming is even contemplating jumping off a cliff. Why does that not impress me?
Myth#5: All that new money will cause hyper-inflation so Gold will rocket.
This is what just happened:
- The banks lent a lot of money.
- People used that money to buy all sorts of things, much of which they didn't really need and most of which did not generate income that could pay the loan back, that's inflationary.
- Then the people who borrowed the money didn't pay it back.
- The banks were then "technically" insolvent.
- The Government printed some more money and handed it over to the banks to help make up for all the money they had lost.
The problem is that it looks like the amount of money that has been printed so far is a lot less than the amount of money that was lost.
Also, regardless of what clever accounting standards you use, the reality was that money was actually "lost" when it was handed over to the people who didn't pay it back, not when the genius bankers and their auditors finally woke up to the fact that it wasn't coming back. So there was a time when banks were throwing money around with gay abandon, and THAT caused inflation, THEN...(just no one noticed - more on that later).
NOW it looks like there is deflation (unless of course you are an economist), prices and incomes are going down and there is an expectation they will go on going down, and banks are not throwing money around with gay abandon. Chances are it will stay that way until the market for securitisation re-starts (http://seekingalpha.com/article/143444-is-the-u-s-style-securitization-model-dead), and that's only going to happen after some of the more obvious flaws have been fixed (http://seekingalpha.com/article/144476-geithner-s-plan-doesn-t-get-it-securitization-is-the-solution-not-the-problem here is a piece of advice, don't hold your breath.
All that happened so far was propping up Zombie Banks, that doesn't cause inflation, that's what they did in Japan where it caused deflation, just this time in USA they put a different spin on it. Professor Antal Fekete wrote a great article on that (http://www.thedailybell.com).
Myth #6: Gold is essential to back up a currency.
Money is nothing more than something used to facilitate trade. So say I got a cow and I want to buy one banana, well I could cut off the cow's ear and trade that for a banana, or I could sell the cow for money (of a style and denomination that I know the banana seller will accept), and use a small faction of that money to buy the banana.
It doesn't actually matter what the money is, it could be beaver pelts (very popular with early American settlers), it could be rare cowry shells, it could be silver, it could be gold, or it could be an asset backed security (ABS) or even asset backed bit's of paper saying I promise to pay the bearer one banana or whatever. So long as there is a broad consensus on how much a cow's ear and a banana is worth in the currency of choice, it works.
Fiat currency can work too and it's not new; the Chinese had it in the Sixth Century (and it got out of hand then and caused massive inflation); that's backed up by the promise of governments that they can tax their subjects until eternity (although whether the future generations will be inclined to accommodate the debts being run up now is less than completely certain, as the Governor of California is finding out).
Take an example:
- 1920, the German Government had agreed to pay huge sums of money in reparations under the treaty of Versailles.
- They didn't have any money, they certainly didn't have any gold, and they were afraid to raise taxes or cut spending, so they printed it, lots of it.
- Foreign speculators then shorted this money, and it's value went down-down-down.
- After three years one "old" Mark was worth (in terms of buying stuff) basically nothing.
That was hyper-inflation. There is still a bit of a debate as to whether the cause of that was (a) printing the money in the first place or (b) the foreign speculators.
Anyway in 1923 along came a very smart guy called Gustav Stresemann who "created" a new money, called the Rentenmark, this was "backed" by agricultural land and industrial infrastructure...sound's familiar?
So instead of "promising to pay the bearer one ounce of gold" or whatever, this money promised to pay the bearer "two cows, five acres of land in Bavaria, and a second-hand bottling machine". Another word for that kind of money is an "asset-backed-security", which works great so long as everyone believes in the value of the asset backing the security.
Thanks to that 1923 to 1929 were the "Golden Years" when Germans enjoyed stunning prosperity. Then along came the US stock market crash, followed by Great Depression, then unemployment, then war; but that was nothing to do with the color of the "money" that Gustav Stresemann created.
This is the thing, when the Fed buys a treasury that increases money supply, same deal for when a bank (or an insurance company or a pension fund) buys an ABS.
Up to recently a large part of the credit in USA was backed by ABS, now that "Shadow Central Bank" got shut down. Until it starts up the real Central Bank is going to have to take up the slack, but unless they print money faster than the ABS system was creating it AND faster than the bankers managed to lose it, that's deflationary. And by the way, they can't just print it, that's an illusion, as Professor Fekte points out the Fed must “post collateral with the Federal Reserve Agent (who is not under the jurisdiction of the Fed but under that of the government)”.
Myth #7: The price of gold is historically 15x the price of oil.
That's an industry "rule of thumb" in some quarters, but is it right? Here is a plot of oil price against gold (annual averages).
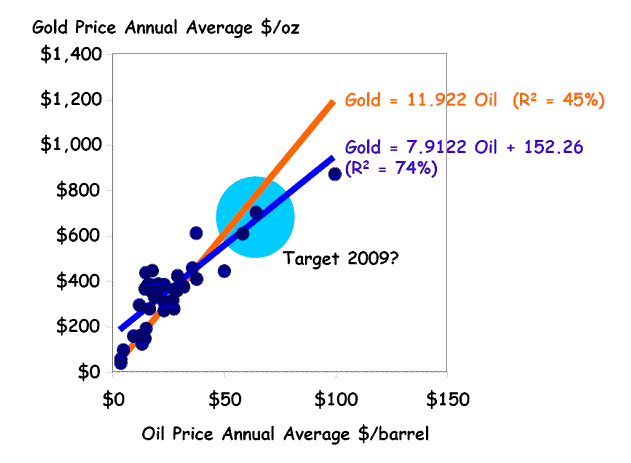
The line that is zeroed and says Gold = 11.9 times the oil price, (not 15 by the way), that has an R-Squared of 45% which means that the formula explains 45% of the changes in the gold price since 1971. That's not much better than CPI as an explanatory variable.
76% R-Squared is a lot better but hardly perfect, if history repeats it should get you within 25% ninety-five percent of the time (it's the other 5% of the time that's the kicker, that's called a Black Duck or something).
So why does oil correlate with gold and CPI doesn't?
Perhaps someone made a mistake in calculating CPI? That's not a new idea; this is a plot of the reported CPI in USA compared to the annual change in the price of oil:
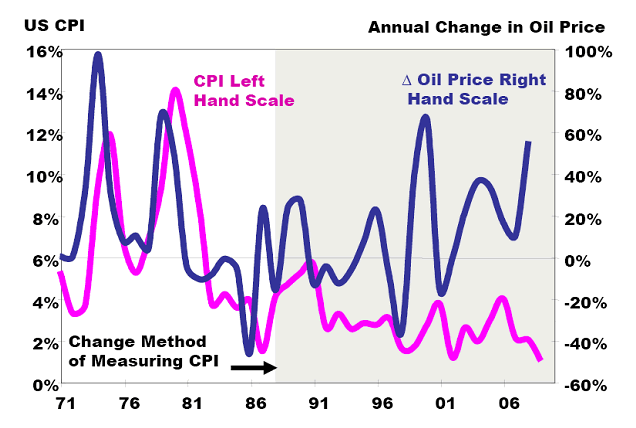
In the 1970's America imported 40% of it's oil (and that dropped to 30% by 1975), then there was a fantastic correlation between oil prices and CPI (one or two year lag).
Then in order so that they could "streamline" the foundations of the great new QTM monetary theory and do "Inflation Targeting", they changed the way CPI was calculated, and "miraculously" that correlation disappeared, even though in 2008 America imported 70% of it's oil. And surprise-surprise, magically inflation disappeared too!
But did it really disappear?
Perhaps a better measurement for inflation over the past fifteen years since they cleverly changed the way it's measured, was the price gold?
That would explain the huge rise in the price since 1999, so perhaps the Bureau of Labor wasn't keeping track of "real" inflation...but gold was?
Next?
In a recent article I looked at the things that cause bubbles (http://www.marketoracle.co.uk/Article12114.html), it looked like one was fear, another was "easy-money". Well there was a lot of fear recently, and also there was a lot of money floating around (in some quarters), that belonged to people who had managed to avoid the pop of the stock markets and real estate. And that money had no-where to go; some of it went into gold. So there was an outbreak of fear, and there was an outbreak of easy money, those are the two essential ingredients for a bubble to form.
If that's right whenever the fear subsides (the recent rally in the stock market and the rate of change of the rate of change of the rate of change in house prices appears to be stabilizing, suggests that the blind terror of six months ago has eased), or whenever the supply of loose money looking for a home, runs out, then if there was a bubble, it might pop?
Of course the link between oil and gold is most probably not direct (likely oil price rises cause "real" inflation and gold is driven by "real" inflation (rather than the numbers put out by the US Bureau of Labor)).
But let's suppose that relationship between oil prices and gold holds, if so the thing that will determine the "correct" price of gold will it be the price of oil.
In that case the key is where will oil go?
That's a hard call, previously I suggested that in the medium-term that was more to do with politics than markets or GDP (http://seekingalpha.com/article/140546-the-price-of-oil-parasite-economics-explained). If $147 was a bubble (rather than a supply/demand cycle) and $32 was the trough that followed, market-long-wave theory says the equilibrium should be about $58.
That's about where it is now, so put that into the formula (above) and you get an "equilibrium" price for gold of about $611. Now it's about $930 so by that logic, now it's about 50% too high, and market-long-waves says that if that was a bubble, and it pops, the trough could be 34% below the peak (1-1/(1.5), which would get it down to about $400 at the bottom.
But I don't think $147 was all bubble, I figure the "right" price now is about $75 which is the Saudi target and I think what Saudi wants Saudi will get. That gives the equilibrium price of $746, so if (Big IF) today's price is a bubble and it pops, then by that logic the bottom will be about $600.
How about CPI?
The way it looks gold IS sensitive to inflation, just it doesn't look up the US CPI numbers, which proves that "gold-bugs" are smarter than the US Bureau of Labor (which isn't saying much). So how about "repairing" the CPI numbers?
There are people who did that (http://www.shadowstats.com/ and http://www.marketoracle.co.uk/Article8028.html), but they don't completely explain their methodology, so it's hard to figure if they got it right or not.
The most likely error is the change in methodology in 1999 which basically meant that the shelter component of CPI tracked rents, which was an idea that can most charitably be described as completely idiotic.
So how about adding 50% the increase/decrease in house prices x 30% (about the weighting of shelter). I call that CPIX. That's pretty random, but just to see; this is what you get:
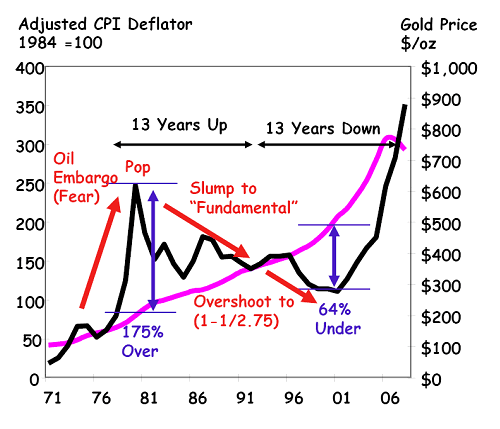
OK I admit it, I got to the number of 50% on the house price inflation (and deflation or disinflation if you like), by "iteration".
The "plain-English" way to say that is "I cheated", but it looks like a nice story that fits with the idea of how bubbles form, and then pop, so humor me, let's run with that idea for a moment.
The period 1971 to 1981 was a period of "fear", OPEC had demonstrated that it had a firm hold on the soft parts and if it felt like squeezing then that's what it would do. On top of that, they couldn't spend all the money that started rolling in fast enough so they sensibly shipped it across to a place that could, and...(easy money + fear = bubble).
In about 1980 oil prices started to edge down as other sources of supply were brought on line (example the North Sea), and by 1986 it was game-over and the Saudi's capitulated as the "swing-producer". Also by that time the oil producers had started to figure out ways to spend more of the money at home.
And if that's the explanation then well...(No easy money + No fear = Pop).
If that's right then the "right" price for gold right now is about $750, which is about where the second "oil" logic argument ended up, so if there is a pop, then the outcome of that will be a bottom of $600.
I know all the "technical" people are saying that gold is stable and there is a possibility of a big jump at some point. I don't see that, I smell a bubble.
By Andrew Butter
Andrew Butter is managing partner of ABMC, an investment advisory firm, based in Dubai ( hbutter@eim.ae ), that he setup in 1999, and is has been involved advising on large scale real estate investments, mainly in Dubai.
© 2009 Copyright Andrew Butter- All Rights Reserved
Disclaimer: The above is a matter of opinion provided for general information purposes only and is not intended as investment advice. Information and analysis above are derived from sources and utilising methods believed to be reliable, but we cannot accept responsibility for any losses you may incur as a result of this analysis. Individuals should consult with their personal financial advisors.
Andrew Butter Archive |
© 2005-2022 http://www.MarketOracle.co.uk - The Market Oracle is a FREE Daily Financial Markets Analysis & Forecasting online publication.