


Analyzing the Australian Dollar, Up, Down, and Under
Currencies / Forex Trading Jul 22, 2009 - 01:42 PM GMTBy: Gary_Dorsch

 Viewed from the outside, trading in the arcane world of foreign exchange might appear to be quite glamorous. However, attempting to anticipate the next major move in the Euro, yen, or British pound, can be injurious to one’s mental health or pocketbook, especially when schizophrenia often rules the day. Yet despite the enigma that surrounds the $4-trillion per day FX market, when staring at the weekly price charts, the outside observer will notice established and methodical price trends in the currency markets that can last for weeks, months, or even years.
The Australian dollar is increasingly popular with currency speculators, because of its volatile price swings, a relative lack of central bank intervention, and lends exposure to Asian tiger economies and the “Commodity Super Cycle.” The “Aussie” dollar is currently the sixth-most-actively traded currency in the world, behind the US-dollar, the Euro, Japanese yen, British pound, and the Swiss franc, and changes hands in roughly 6% of worldwide foreign-exchange transactions.
 In the 26-years since the Aussie dollar was floated in the open market, its highest value relative to the US-dollar was 98.50-cents reached on July 15, 2008. Its lowest point was 47.75-cents in April 2001. Rich in natural resources and occupying an area the size of the United States, Australia is a major exporter of agricultural goods, particularly wheat and wool, minerals such as iron-ore, gold, nickel, copper, and uranium, and energy, such as natural gas and coking coal.
Currently ranked as the 14th largest in the world, Australia’s $825-billion economy is dominated by its services sector, which accounts for 68% of its annual output. Yet although the agricultural and mining sectors account for only 10% Australia’s GDP these sectors account for nearly 60% of the nation’s exports. For decades, Australia’s balance of trade has been linked to trends in the commodity markets, which in turn, has brandished the Aussie’s reputation as a commodity currency.
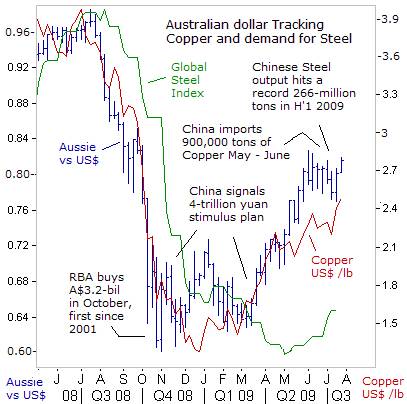
As the world’s fourth-largest producer of gold, the Australian dollar displayed an 84% degree of correlation with the yellow metal until 2008. Since then, for the 12-months ended June 2009, the Aussie dollar has been estranged from gold, and instead, became wedded to the copper market, displaying an 82% degree of correlation with the red-metal. Since coking coal and iron ore, key ingredients for making steel, are Australia’s two biggest commodity exports, the outlook for the global economy and demand for steel, are influencing the Aussie dollar.
During the height of the global banking crisis, the Aussie dollar was tumbling in free-fall, skidding from a record high of 98.50 US-cents in July 2008, to as low as 60-cents level by October. To cushion the slide, the Reserve Bank of Australia (RBA) intervened to buy A$3.15-billion of its currency in October, as the turmoil in global markets sent the Aussie tumbling to five-year lows. That was the largest amount ever bought by the RBA in a single month and its first purchase since 2001.
The RBA’s intervention was a paltry sum of cash in a market that trades about $265-billion per day. But the intervention provided a degree of psychological support, as traders paused to calculate what other tricks the central bank might have up its sleeves. As fate would have it, riding to rescue of the Aussie dollar and its mining industry, was Beijing’s surprise decision in November 2008, to spend 4-trillion yuan ($585-billion) on various infrastructure projects, equal to about 15% of the entire Chinese economy, after 20-million Chinese migrant workers had lost their jobs.
“We face unprecedented difficulties and challenges,” China’s Premier Wen Jiabao told the parliament in Beijing on March 5th, “The nation needs to reverse the economic slide as soon as possible,” he said. Since Jiaboa’s speech, the Australian dollar began climbing higher along an upward trajectory, from 64-cents to as high as 82.25-cents in June. China bought one-fifth of Australia’s total exports in March, and its imports soared 80% in the first four-months of this year, with the export revenue cushioning the Australian economy from the dire effects of the global recession.
Australian exports to China helped to offset sharply lower sales to other key trading partners, with exports to Japan down 36%, and sales to the US down 33% from their peak. Still, the biggest threat to Australian miners wasn’t the lack of demand from Chinese steel mills and factories, but rather locking in sharply lower prices for its principal commodities, with one-year contracts for coking coal fetching 55% less than a year earlier, and iron ore prices about 30% lower.
About half of the iron ore that Australia’s Rio Tinto (RTP) mined in the first half of this year was sold on a spot basis, with about 86% shipped to China. RTP reached final price settlements on iron ore shipments to Chinese, Japanese, Korean, and Taiwanese steel mills that cut contract prices by 33-percent. China, buyer of half of all traded iron ore, initially sought a price cut of 45%, but softened its demands after spot iron-ore prices rose above $90 /ton for the first time in nine months.
Also working in Rio’s favor is data suggesting non-Chinese demand is slowly returning. In June, iron ore exports to countries other than China from Australia and Brazil doubled from the previous four-months. For Australia’s mining giants, BHP Billiton and Rio Tinto, the saviors during the global economic meltdown, were Chinese and Indian steel makers - the only major producers to increase output this year. Nearly two-thirds of the world’s steel output comes from Asia, and world leader, China increased its output to a record 55-million tons in June, while India expanded its steel production by 1.3% in the first half.
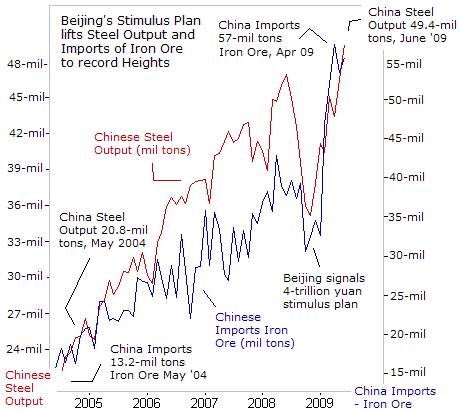
Overall, world steel output plunged -21.3% in the first six-months of 2009 from a year ago, the World Steel Association said. North American output almost halved while European output was down 43.2 percent. But China’s crude steel production, the largest in the world, rose to a record 266-million tons in the first half as Beijing’s $586-billion stimulus plan boosted demand from builders and carmakers. Benchmark Chinese steel prices have gained 17% since April 1st.
In order to feed its steel mills, China imported 55.3-million tons of iron in June, up 3% from May to reach the second highest level on record. In the first six-months of the year, total imports reached 297-million tons, up +29.3% from a year earlier, with steel mills and traders buying in large volumes. Rio Tinto reported on July 15th, an 8% rise in Q’2 iron ore production from a year earlier.
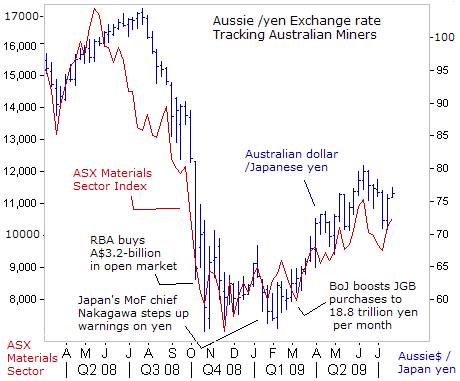
The direction of Australia’s mining companies is of great interest to currency traders based in Tokyo, - the biggest movers and shakers in the Australian dollar. In the second half of the twentieth century, Australian trade shifted decisively away from Europe and North America to Japan and other East Asian markets. Australia’s largest export markets are Japan, China, the US, South Korea and New Zealand, and likewise, the Aussie /yen exchange rate has become a hotbed of speculation.
With the Bank of Japan (BoJ) pegging its overnight loan rate at 0.1%, the infamous “yen carry” trade has become popular again. Arbitrageurs and traders are borrowing in yen at cheap interest rates and locking in higher yields offered by the Australian dollar. Since March 18th, when the BoJ boosted the amount of JGB’s it would buy to 1.8-trillion yen ($18.3-billion) a month from 1.4-trillion yen, carry traders have been bidding up the Aussie dollar to as high as 75-yen. For traders with greater risk appetites, Aussie miners have been a favorite target for speculative profits.
A number of large multinational mining companies including BHP Billiton, Newcrest, Rio Tinto, Alcoa, Chalco, Alcan, and Xstrata operate in Australia. There are also a lot of small mining and mineral exploration companies listed on the Australian Stock Exchange (ASX). Overall, the materials sector represents 20% of the ASX by market capitalization, and almost one-third of the companies listed.
Mining’s share of Australia’s economic output is only 6%, yet minerals and metals account for roughly 35% of Australia’s exports. In Canada and Norway, commodity exports also play as significant a part in the economy. In Canada for instance, mining represents about 3.6% of the Canadian economy but 32% of its exports. In Norway, the oil industry represents 19% of economic output, but 46% of exports. In sharp contrast, the US mining sector represents only 1.6% of American GDP.
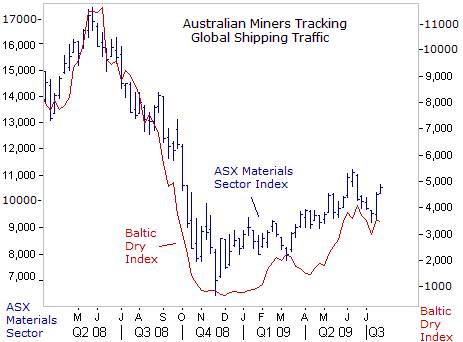
Following the intricate web of inter-market connections, Australia’s miners are tracking the direction of the Baltic Dry Index, which measures the cost of shipping key raw materials, such as iron ore, coal, grain, cement, copper, sand, gravel, fertilizer, and plastic granules. Because the index tracks the cost of shipping raw materials, instead of intermediate or finished goods, it provides a clear measurement of the volume of global trade at the earliest possible stage.
The index is not tradable, which means the only legitimate users are booking cargo ships, making the Baltic Dry Index, devoid of speculative content. The Baltic Dry Index hit an all-time high of 11,793 on May 5, 2008. Then it plunged to 663 on December 5th, a loss of 95-percent. Since its December low, the index has briefly traded above 4,000, seen by the “green shoot” crowd as proof of a revival in global trade, even though the index is still down 68% from its May 2008 high.
Beijing is taking advantage of beaten-down commodity prices to build its strategic reserves. China’s imports of copper hit an all-time record for a fifth straight month in June, reaching 379,000-tons. Nickel imports, used to make stainless steel, also hit a record of 41,008 tons, up from 25,032 tons in May, and imports of aluminum hit 267,861 tons, helping to support the Baltic Dry Index.
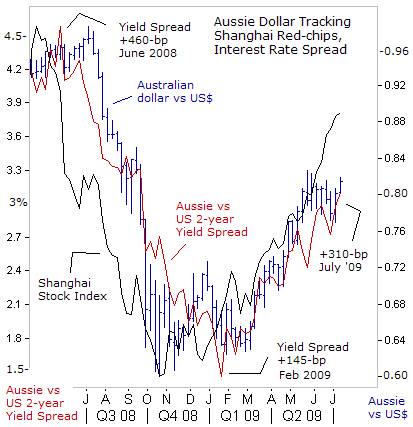
News that China’s economy rebounded to a +7.9% annualized growth rate in Q’2, up from +6.1% in the first quarter, got the attention of Aussie traders, who also closely track the direction of the Shanghai red-chip index. The Australian dollar advanced above 80-US-cents as commodities buoyed by a booming Chinese stock market. China’s central bank is inflating its M2 money supply at a 28.5% annualized clip, in a brazen effort to re-inflate its stock market, and generate a paper trail of wealth.
Interest rate differentials also play a big part in influencing the Aussie dollar. The premium that traders receive from two-year Australian government debt over US Treasuries of the same maturity has widened to +310-basis points, the most since October. The Aussie dollar is likely to maintain its wide interest rate advantage, after Fed chief Ben “Bubbles” Bernanke said on July 21st, “The Fed believes that a highly accommodative stance of monetary policy will be appropriate for an extended period,” telegraphing a zero-percent fed funds rate into 2010.
The Fed cut the fed funds rate to near zero and pumped $1.8-trillion into the banking system, which could ignite faster inflation once the economic recovery gains traction. “We will not allow the broad measures of money circulating in the economy to rise at a rapid enough rate that would eventually cause inflation,” Bernanke vowed. But history shows that the Bernanke- Greenspan Fed will continue to keep interest rates pegged at ultra-low levels until huge bubbles have expanded in the commodity and stock markets. As in China, the US-central bank is also engaging in a clandestine attempt at jump starting the economy, by inflating housing and stock market values through explosive increases in the money supply.
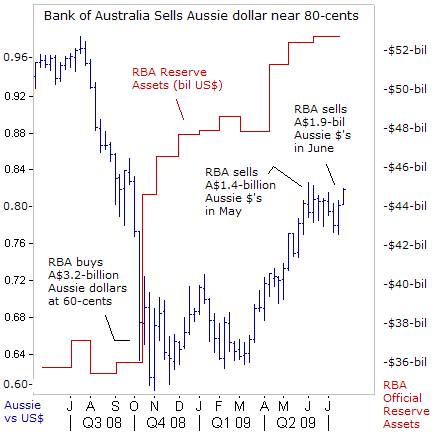
The Reserve Bank of Australia (RBA) has proven itself a very astute currency trader. Having bought A$3.2-billion of Aussie dollars near 60-US-cents last October, the RBA booked a solid profit, after selling A$1.94-billion on the spot foreign exchange market near 80-cents during June, the largest monthly sale on record going back to 1995, and followed a hefty A$1.4-billion of net sales in May. The RBA’s clandestine activities are fueling speculation that it’s leaning against a further rise in the Aussie dollar’s exchange rate above 80-cents. Such interventions however, are usually smoothing operations, and can’t change a trend.
This article is just the Tip-of-the-Iceberg of what’s available in the Global Money Trends newsletter, for insightful analysis and predictions of the future direction of (1) top stock markets around the world, (2) Commodities such as crude oil, copper, gold, silver, steel, and soybeans (3) Foreign currencies, including exotics, (4) Libor interest rates and global bond markets (5) Central banker "Jawboning" and Intervention techniques that move markets.
By Gary Dorsch,
Editor, Global Money Trends newsletter
http://www.sirchartsalot.com
GMT filters important news and information into (1) bullet-point, easy to understand analysis, (2) featuring "Inter-Market Technical Analysis" that visually displays the dynamic inter-relationships between foreign currencies, commodities, interest rates and the stock markets from a dozen key countries around the world. Also included are (3) charts of key economic statistics of foreign countries that move markets.
Subscribers can also listen to bi-weekly Audio Broadcasts, with the latest news on global markets, and view our updated model portfolio 2008. To order a subscription to Global Money Trends, click on the hyperlink below, http://www.sirchartsalot.com/newsletters.php or call toll free to order, Sunday thru Thursday, 8 am to 9 pm EST, and on Friday 8 am to 5 pm, at 866-553-1007. Outside the call 561-367-1007.
Mr Dorsch worked on the trading floor of the Chicago Mercantile Exchange for nine years as the chief Financial Futures Analyst for three clearing firms, Oppenheimer Rouse Futures Inc, GH Miller and Company, and a commodity fund at the LNS Financial Group.
As a transactional broker for Charles Schwab's Global Investment Services department, Mr Dorsch handled thousands of customer trades in 45 stock exchanges around the world, including Australia, Canada, Japan, Hong Kong, the Euro zone, London, Toronto, South Africa, Mexico, and New Zealand, and Canadian oil trusts, ADR's and Exchange Traded Funds.
He wrote a weekly newsletter from 2000 thru September 2005 called, "Foreign Currency Trends" for Charles Schwab's Global Investment department, featuring inter-market technical analysis, to understand the dynamic inter-relationships between the foreign exchange, global bond and stock markets, and key industrial commodities.
Copyright © 2005-2009 SirChartsAlot, Inc. All rights reserved.
Disclaimer: SirChartsAlot.com's analysis and insights are based upon data gathered by it from various sources believed to be reliable, complete and accurate. However, no guarantee is made by SirChartsAlot.com as to the reliability, completeness and accuracy of the data so analyzed. SirChartsAlot.com is in the business of gathering information, analyzing it and disseminating the analysis for informational and educational purposes only. SirChartsAlot.com attempts to analyze trends, not make recommendations. All statements and expressions are the opinion of SirChartsAlot.com and are not meant to be investment advice or solicitation or recommendation to establish market positions. Our opinions are subject to change without notice. SirChartsAlot.com strongly advises readers to conduct thorough research relevant to decisions and verify facts from various independent sources.
Gary Dorsch Archive |
© 2005-2022 http://www.MarketOracle.co.uk - The Market Oracle is a FREE Daily Financial Markets Analysis & Forecasting online publication.