


Weekly Gold and Silver Technical Analysis Report - 18th June 2007 - Technically Precious with Merv
Commodities / Gold & Silver Jun 18, 2007 - 12:04 PM GMTBy: Merv_Burak

With 93% of the “quality” stocks on the rise and only 40% of the gambling variety on the rise this was a “quality” week in the precious metals universe. Will it last?
GOLD : LONG TERM
Still no movement in the long term P&F chart so we continue in a P&F long term BULLISH trend.
As for the normal indicators, gold closed above its still slightly positive sloping moving average line. Price momentum (strength) is still in its positive zone but with a negative trigger line indicating the pressure is towards the down side. The long term volume indicator is below its trigger line and the line has turned down. Putting it all together the indicators remain just slightly better than last week so I will remain with last week's BULLISH view of the long term gold position.
INTERMEDIATE TERM
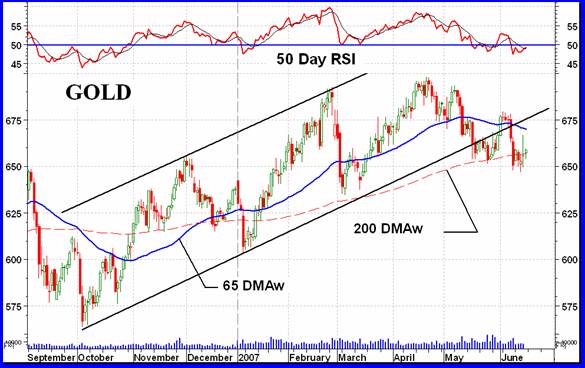
The intermediate term P&F is just the opposite of the long term. It is in a BEARISH mode with a projection that continues to be to the $605 level. It's a long way from a bullish reversal at this time.
The chart above shows a continuing weakening in the intermediate term indicators although such weakening does not move steadily in one direction. This past week the momentum indicator perked up a bit but not enough to carry it back into the positive. Momentum is still in the negative zone but just above its negative sloping trigger line. Although the price tried to perk up during the week all the action remained below its negatively sloping moving average line. As for the volume indicator, it is below its negative trigger line.
With the indicators mostly negative I have no reason to change from my last week's intermediate term rating of BEARISH.
SHORT TERM
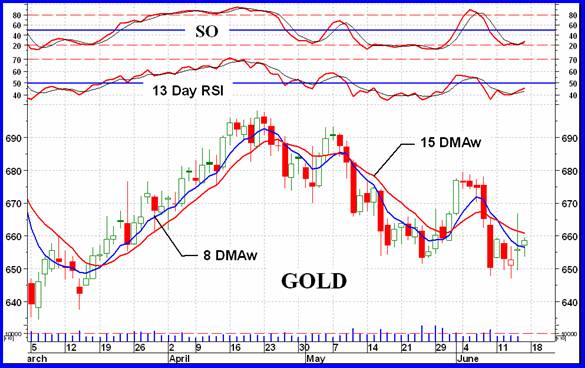
The past few weeks have been a short term roller coaster. Up one week and down the next. Looking at the end of week action one gets the impression that it is just about to go up again. Although still below the short term moving average line (the red one) we see that the momentum (13 Day RSI) has stalled and is in fact moving higher. It has crossed its moving average trigger line to the up side although the indicator is still inside its negative zone. One cautionary note is the low volume recently. It almost looks like speculators are not sure which way to go.
Short term I must stay with the latest confirmed trend until its reversal has been confirmed. So, I remain bearish on the short term but would most likely reverse should gold (Aug Futures contract) close at or above $667.00.
IMMEDIATE TERM
As for the next couple of days, my flip of the coin tells me that the immediate trend is to the up side and that should continue into the first of the week. We have a close above the very short term moving average line (the blue one) and a very aggressive SO that is bouncing off its oversold line and is above its trigger line. A close below $650 would, however, probably change the climate and the direction.
NORTH AMERICAN GOLD INDICES
This week we look in on the AMEX Gold Miners Index. Unlike the AMEX Gold BUGS Index which includes companies involved in gold mining that “do not hedge their gold production beyond 1.5 years”, the AMEX Gold Miners Index includes companies “involved primarily in the mining for gold and silver”. You figure out the distinction, it's just too subtle for me. Well, I guess I might figure it out but they could do with just one Index, don't you think?
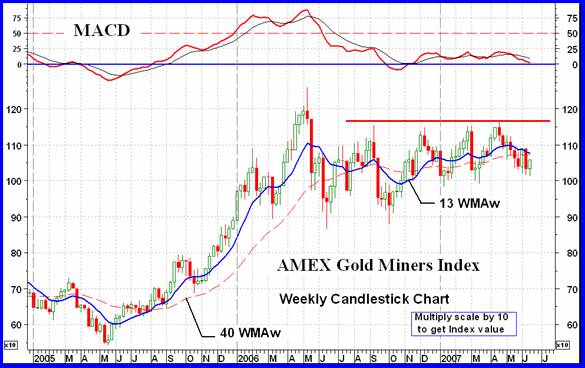
Anyway, the Gold Miners Index is not much different from the other four major Indices that we look at in this section. They all have pretty well the same component stocks. Some of the Indices may have only 15 component stocks and some may have 40 but when you calculate your Index by placing greater weight on the largest companies you get the major Index value effect coming from just a few stocks and they are the same few stocks from Index to Index.
We continue to have a battle here for the past year now. The Index (i.e. the few largest component stocks) just doesn't know which way to go so they have been hanging in and moving sideways. Unlike the speculative stocks which have done well for speculators over the past year (see the Merv's Gamb-Gold Index later in the commentary) the largest gold stocks have not provided “investors” with any real profits. They just might do so eventually so if one is an “investor” one can sit and wait. Otherwise one might go for the more speculative stocks and take your chances. BUT the gold stocks should not be considered as “investments”, only as speculative trades where one knows that a sell WILL come sometimes after a buy. That “sometimes” may be the next day or the next year depending upon the market action for that stock. But I am digressing again.
The MACD indicator (probably the most popular momentum indicator) is just about ready to drop into its negative zone. The criteria most often mentioned for the use of this indicator is to buy when the indicator moves above its trigger line and sell when the indicator moves below its trigger line. This often works okay but too often it does not. Over the past 6 months you would have bought-sold-bought-sold-bought-sold and your head would be spinning. As readers to these commentaries have noticed I like to use a combination of a few simple indicators to determine the market direction. Do they work better than the MACD? Well, sometimes not but more often I think they do. Anyway, occasionally I show the MACD because it is so popular and so many readers are familiar with it.
As long as the Index stays below that resistance level at 1165 we are going nowhere with the Index. The lower level is not quite as clear but should the Index drop below the 1000 level then I think that this Index, and the gold stock market, may be in deep trouble. Unfortunately, despite the advance this past week the general direction seems to be towards the lower levels.
MERV'S PRECIOUS METALS INDICES
So, we saw how the “weighted” gold stocks are doing, now let's see what the AVERAGE performance of the gold stocks looks like. As often mentioned, this is probably the one place where you will learn if there is a real difference in the performance of the “quality” stocks versus the speculative variety. I had received some interesting comments to the statistics that I published a few weeks back comparing the performance of the “quality” stocks versus the speculative stocks over bull and bear market periods. In a nutshell, during a bear market BOTH classes of stock lose just about the same percentage of their price but during a bull market there is a world of difference in performance of the two classes with the speculative stocks far out performing the quality .
First, a quick look at the Merv's Composite Index of Precious Metals Indices, shown here a few weeks back. We still have a valid perfect potential double top pattern in place. The Index action over the past few weeks has not invalidated the pattern. The MACD is just a shade above its neutral line, below its trigger line and heading lower. The Index itself is still below its negative intermediate term moving average line and below its still slightly positive long term moving average line. I would rate the Composite Index as BEARISH on the intermediate term and NEUTRAL, at best, on the long term.
MERV'S GOLD & SILVER 160 INDEX
As always, when reviewing what's happening to the average gold stock I first look in on my overall universe of 160 stocks. Here, the average stock gained only 1.5% on the week versus a gain in the neighborhood of 3-4% for the majors. A quick look at the gold sector Indices tells me that this week the more speculative stocks were the worst performers holding back the universe performance. Overall we had 93 stocks moving higher during the week (58%) and 60 stocks moving lower (38%). A poor ratio of winners to losers for a week that was suppose to have been a good week for stocks. All is not as rosy as the week's majors seem to imply. The summation of individual stock ratings moved slightly towards the positive during the week but still all time periods were in the BEARISH camp with ratings of 51% short term, 65% intermediate term and 58% long term. We'll have to wait another week or two of good markets before these ratings move into the bullish side.
The MACD is still comfortably above its neutral line but is below its trigger line and moving lower. The Index is below its negatively sloping intermediate term moving average line but still above its positively sloping long term line. BEARISH trend for the intermediate term but still BULLISH long term.
Although there were lots of 10% and 20% movers during the week there were no stocks that made it into my arbitrary plus/minus 30% category to indicate over speculation during the week.
MERV'S QUAL-GOLD INDEX : MERV'S SPEC-GOLD INDEX : MERV'S GAMB-GOLD INDEX
Here we look at the three sector Indices to see which sector of gold stocks were moving during the week and which were not. A look at the Indices Table shows that the second tier stocks did the best while the gambling stocks were the worst with the “quality” just slightly below the second tier. The Spec-Gold Index, representing the second tier, is made up of the 30 largest stocks in the universe after the Qual-Gold stocks so they are just about top quality but not there yet. The performance of the 30 component stocks in each sector tells us a more realistic story on the week's activity. 93% of the Qual-Gold stocks advanced during the week while 67% of the Spec-Gold advanced and only 40% of the Gamb-Gold stocks advanced. The Gamb-Gold Index (along with its sister Index, the Spec-Silver Index) was the only Index with more decliners than advancers on the week. This bearish sentiment towards the more speculative stocks is NOT a sign of strength in the gold stocks but more a sign of weakness. Speculators are getting out and shifting their capital into the more “safer” stocks. The next few weeks may be very telling as to the trend for the foreseeable future.
For the Qual-Gold Index the MACD is just about to go negative and is below its trigger line. The Index is below both its moving average with the intermediate being negative and the long term still very gently positive in slope. I would classify the intermediate as BEARISH and the long term as NEUTRAL, at best.
For the Spec-Gold Index the MACD is somewhat further above its neutral line than the Qual was, but it still is moving lower and is below its trigger line. The Index is below its negative intermediate term moving average line but has once more moved above its positive long term line. I would rate this Index as still BEARISH on the intermediate term and BULLISH on the long term.
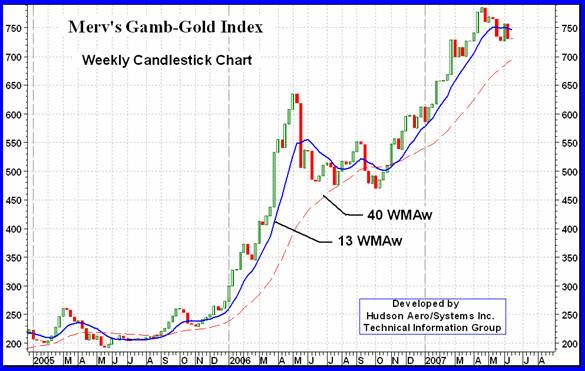
For the Gamb-Gold Index the MACD is well above its neutral line but below its trigger line and heading lower. The Index is below a negative sloping intermediate term moving average line but still far above its positive long term line. I would rate this Index as NEUTRAL on the intermediate term and BULLISH on the long term.
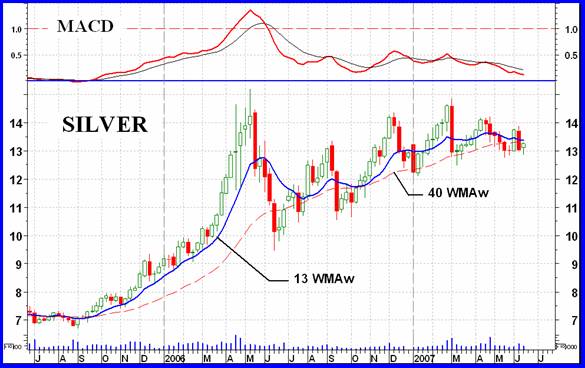
SILVER
Although I didn't do so, you could draw a trend line from the low in Sept of 2005 through the low of June 2006 and we get right to the low reached this past week in the price of silver. In other words, from a long term trend stand point silver does not have any maneuvering room on the down side. It must go higher or risk being put into a bearish mode. The MACD is not much better but is still above its neutral line heading lower below its trigger line. As for the moving averages, well, silver price is below its negative intermediate term average and below its positive long term average. As with many of the stock Indices, silver can be rated as BEARISH on the intermediate term and NEUTRAL on the long term.
MERV'S QUAL-SILVER INDEX : MERV'S SPEC-SILVER INDEX
Two silver Indices, two directions of movement. The Qual-Silver Index closed the week on the up side by 2.8% while the Spec-Silver Index closed on the down side by 1.1%. The advancing issues also showed the difference with 90% of the Qual stocks closing up while 64% of the Spec stocks closed down. As with the gold stocks the movement was with the “quality” while speculators seemed to be dumping their more speculative stocks. As mentioned earlier, not the actions of a strong market. The next few weeks might be interesting.
For the Qual-Silver Index we have the MACD indicator still comfortably in the positive zone but below its trigger line and moving lower fast. The Index is below its negative sloping intermediate term moving average line but has now moved back above its still positive long term moving average. This Index may be rated as BEARISH on the intermediate term but still BULLISH on the long term.
For the Spec-Silver Index the MACD is also above its neutral line but below its trigger line and moving lower. The Index closed the week below both its moving averages but the intermediate term average is heading downward while the long term is still pointing upward. We can rate the Index as BEARISH on the intermediate term and NEUTRAL on the long term.
MERV''S PRECIOUS METALS INDICES TABLE
Well, that's it for this week.
By Merv Burak, CMT
Hudson Aero/Systems Inc.
Technical Information Group
for Merv's Precious Metals Central
Web: www.themarkettraders.com
e-mail: merv@themarkettraders.com
During the day Merv practices his engineering profession as a Consulting Aerospace Engineer. Once the sun goes down and night descends upon the earth Merv dons his other hat as a Chartered Market Technician ( CMT ) and tries to decipher what's going on in the securities markets. As an underground surveyor in the gold mines of Canada 's Northwest Territories in his youth, Merv has a soft spot for the gold industry and has developed several Gold Indices reflecting different aspects of the industry. As a basically lazy individual Merv's driving focus is to KEEP IT SIMPLE .
To find out more about Merv's various Gold Indices and component stocks, please visit www.themarkettraders.com and click on Merv's Precious Metals Central . There you will find samples of the Indices and their component stocks plus other publications of interest to gold investors. While at the themarkettraders.com web site please take the time to check out the Energy Central site and the various Merv's Energy Tables for the most comprehensive survey of energy stocks on the internet. Before you invest, Always check your market timing with a Qualified Professional Market Technician
Merv Burak Archive |
© 2005-2022 http://www.MarketOracle.co.uk - The Market Oracle is a FREE Daily Financial Markets Analysis & Forecasting online publication.