


Inflation Is Mortally Wounded And Rapidly Fading, Dump Gold?
Commodities / Gold & Silver 2009 Sep 26, 2009 - 09:32 AM GMTBy: Ronald_Rosen

 It is my opinion that you should ignore all fundamental stories and statistics about runaway prices and hyperinflation at least for the next 8 to 12 months. Gold, silver, and their shares are in the process of being sliced, diced, baked, broiled, and slaughtered. A rare, very rare, opportunity to acquire gold, silver, and their shares at lower than bargain prices will arrive when the [C] leg down that I have been describing and writing about bottoms. This report presents quarterly logarithmic charts of gold, silver, the HUI, and the U. S. Dollar Index. If you are a trader and are familiar with and can handle the short selling process and its dangers you may reap a small fortune over the time span that the [C] leg process (down) requires to complete its work. Its work involves destroying overly enthusiastic precious metals bulls.
The evidence as I see it indicates that the precious metals complex, gold, silver, and their shares will be undergoing a severe decline for about eight to twelve months. I believe this corrective process will be the final part of the correction that began in March 2008. That is the bad news. The good news is that once this corrective process bottoms the next phase of the bull market in the precious metals will be a dynamic, explosive, and market shaking process that engulfs the entire world of markets. The “push me, pull you” process that the gold community has endured for over ten years will have morphed into a gold and silver stampede process.
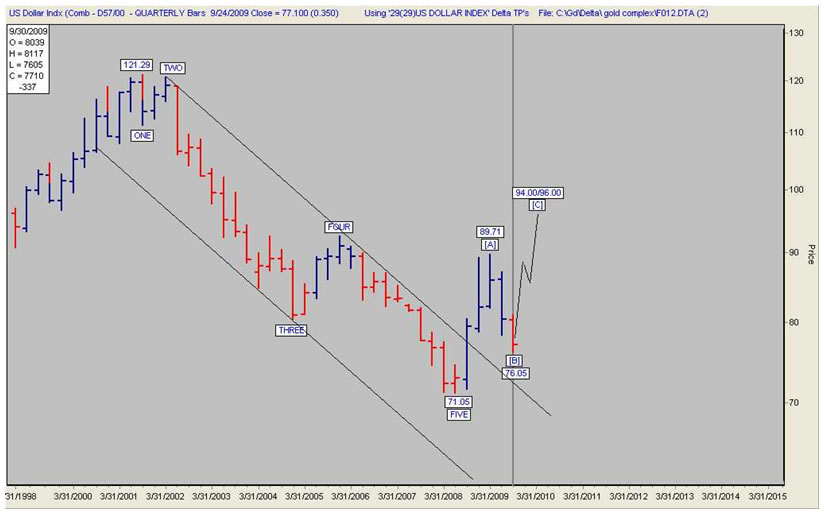
The long term pattern for most active and heavily participated in bull or bear markets tends to unfold in Five Major Waves. Once the Five Major Waves are complete a Major Three Wave reversal tends to take place. The U. S. Dollar Index appears to have completed two of the waves of its Major Three Wave reversal pattern. The third or [C] wave up appears ready to begin its rise. The turns occurred at Delta Long Term turning points.
U. S. DOLLAR INDEX QUARTERLY CHART
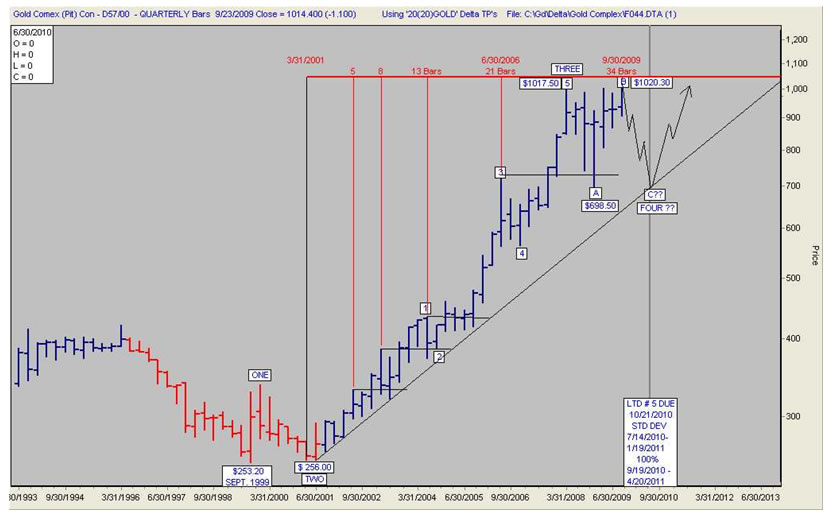
Gold bullion ever since 1999 has embarked on a (probable) Major Five Wave bull market. Gold bullion has completed five minor waves of its Major Wave Three of its Major Five Wave bull market. Ever since March 2008 gold bullion has been working on an [A], [B], [C] correction of the completed five minor waves. Wave [C] down has either begun or will soon begin its downward journey. This is a logarithmic quarterly gold chart. The rising trend line will be intersected by a declining gold price approximately 3 quarters from the end of this September 2009 quarter. Give or take a week or two, the [C] leg for gold may bottom at LTD # 5 low.
The standard deviation for arrival of LTD # 5 low is from July 14, 2010 to January 19, 2011. Since leg [A] up and leg [B] down each consumed about three quarters it is reasonable to assume that the [C] leg down will also consume three quarters. It would be quite normal for the price of gold to decline to a point slightly below the rising trend line. Just about every last remaining gold bug that can be removed from the bull’s back will be removed.
I suspect that “DEFLATION” and “DEPRESSION” will be plastered all over the headlines and television news just as gold is ready to bottom. Looking at this logarithmic gold chart and the rising trend line one could say, “That decline looks reasonably normal. It can’t be so bad.” However, holding a full or over extended position can and will most likely feel like “Holy Hell.”
In addition to its wave pattern the quarterly chart of gold clearly shows that the peaks in Major Wave Three have occurred at Fibonacci quarters 5, 8, 13, 21, and potentially 34. There are three days left in the September quarter which is quarter 34. We will know by Wednesday if this pattern of peaks at Fibonacci designated quarters will continue. It appears to me that the pattern has already been confirmed by the decline in the gold complex this week. A pattern of this type calls for a bottom slightly below the [A] leg bottom of $681. The time consumed by leg [C] down should be relatively similar to the time consumed by the [A] leg down. Once the [C] leg down is complete the bull move should resume.
GOLD QUARTERLY PIT CHART LOGARITHMIC
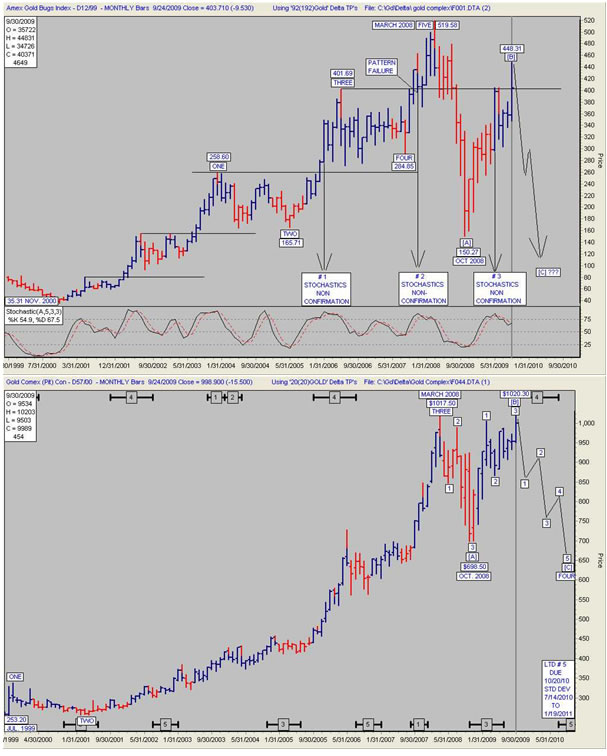
The HUI and gold bullion topped together in March 2008. The [A] legs down of the HUI and gold bullion bottomed together in October 2008. Their [B] legs up topped together. The probabilities are high that their [C] legs down will bottom together. The [C] legs of the HUI and gold bullion should bottom lower than the price at the bottom of their [A] legs down. That means that the HUI may bottom lower than 150.27.
© 2005-2022 http://www.MarketOracle.co.uk - The Market Oracle is a FREE Daily Financial Markets Analysis & Forecasting online publication.