


Stock Market Investor Sentiment Consistency And Credibility
Stock-Markets / Stock Market Sentiment Oct 24, 2009 - 07:46 PM GMTBy: Guy_Lerner

 This week's comments are about why I continue to present the same data on investor sentiment week after week. Some readers have suggested that this data has been of little value during this historic bull run, and so why keep showing it. I believe the data has been relevant, but for those who see otherwise, let's just agree to disagree for now.
Of course, I would like to be right every time I put my thoughts and observations out to the world wide web, but I know that in this game of investing and trading getting it right all the time is impossible. However, I can be consistent in my approach, and this is what I strive to do. Consistency of approach plus getting a few "calls" right equals credibility. And credibility is very important.
So what prompted me to write about this today? It was this email from a reader:
"Your frequently, much touted 'smart money - dumb money' indicator must be causing you acute embarrassment because it has shown no predictive capability during this bear market rally. Just when one requires the indicator to deliver the goods and divine the market it fails miserably.
Do you ever regret making such a chump of yourself so publicly? :-)"
Now I don't like emails like this because well, they are down right nasty. But after writing on the web for over 5 years now, you develop a thick skin. You take the good with the bad. It is mostly good, and that is why I continue to do this.
So let's set the record straight about the sentiment indicators presented week after week in these articles. The "Dumb Money" indicator gave a bull signal in early March, 2009. This is why I wrote the following two articles on March 8: "Investor Sentiment: Bullish Signals" and "Putting A Bullish Signal In Context". On April 19, I suggested that it was "Time To Sell Strength And Tighten Up Stops". This really wasn't a bad call either because for the next 10 weeks the S&P500 actually went nowhere. The "Dumb Money" indicator showed that there were too many bulls in early May, and that is why I reminded everyone with the article written May 10: "Investor Sentiment: It Takes Bulls To Make A Bull Market". In this article, I discussed those rare times (i.e., less than 15% of the signals) when too many bulls is associated with a bull market. Hey it happens; we know it happens and you just have to understand when it is happening. Since early August, the extreme bullish readings in the "Dumb Money" indicator have been associated with a market that has an upward bias. And for the next two months in every weekly sentiment commentary I have stated the following: "There is an upward bias until the extremes in bullish sentiment are unwound, and there will be a bid under the market, and it will be tough to short or bet against this market for the foreseeable future." I don't know how I could have described this any more clearly or frequently. Now in the last three weeks, I have changed my tune, and I am suggesting that "equities are for renting not owning at this juncture, and that there is probably greater risk of a market down draft now than in past weeks."
My comments are not the result of some fantasy, but based upon the indicators themselves and grounded in the data. For the most part, I believe they have been accurate. The problem is that no one I know of or no indicator existed back on March 9 that would have predicted that the S&P500 would have moved up over 60% in 7 months. No one and no indicator!
But this is my proprietary "Dumb Money" indicator, and let's just assume for the sake of argument that it is lousy, and we should abandon sentiment analysis altogether. Ok, then what would you tell all those CEO's and company insiders who have been selling their stock in record numbers over the past quarter? Would you call them a "dumby head" too? Remember, I don't make that data up, I just report it. Oh, by the way, the buy and sell signals from the insider buying and selling data are fairly correlated with the buy and sell signals seen with the "Dumb Money" indicator. It is just another point of light shed on this complicated puzzle called market sentiment.
In the final analysis, I still think the indicators are valid, and they will continue to have validity along as there is fear and greed in the markets.
For me, the purpose of presenting the same data week in and week out is to demonstrate consistency in my approach. My view of investing isn't to be right every time because that is unattainable. I am looking to find and quantify an edge, and I believe sentiment provides such an edge. Once an edge is found, I want to execute on that edge in a disciplined manner.
Think of card counting in black jack. When the deck is in your favor, you want to bet heavy. When the deck is not in your favor, you bet light. A favorable deck says nothing about the next cards coming out of the deck, and a favorable deck does not guarantee a winning hand. However, over time by betting heavy when there is a favorable deck (i.e., your edge), you are skewing the odds in your favor that you will walk away from the table a winner.
So do I feel embarrassed? Or am I a chump? Of course not, and it never really crossed my mind. I do wish I had some holy grail indicator that tells me to buy here and sell here and nails the lows and highs every time. But that indicator doesn't exist, and it is someone else's fantasy. From my perspective, I believe in the data being presented. I will continue to show that data, and I will continue to make data driven observations on the market. I will remain consistent, and I hope this process creates credibility with my readers. This and a few good "calls" along the way.
Now on to this week's data, which is consistently like last week's data.
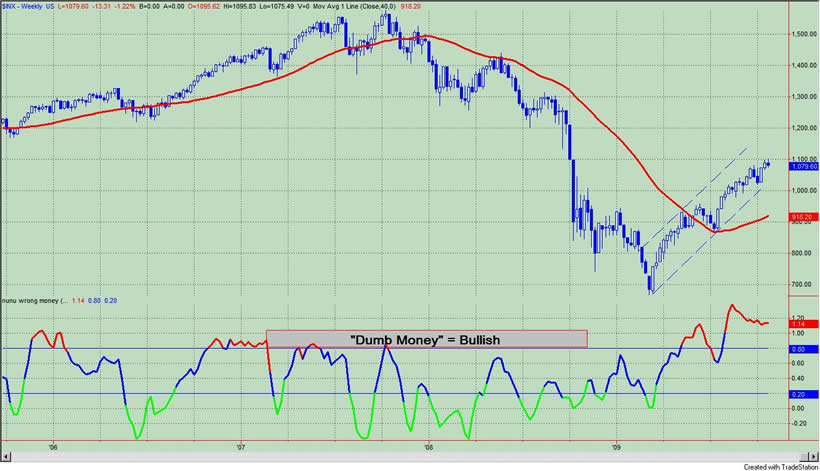
The "Dumb Money" indicator, which is shown in figure 1, looks for extremes in the data from 4 different groups of investors who historically have been wrong on the market: 1) Investor Intelligence; 2) Market Vane; 3) American Association of Individual Investors; and 4) the put call ratio. The "Dumb Money" indicator shows that investors are extremely bullish.
Figure 1. "Dumb Money" Indicator/ weekly
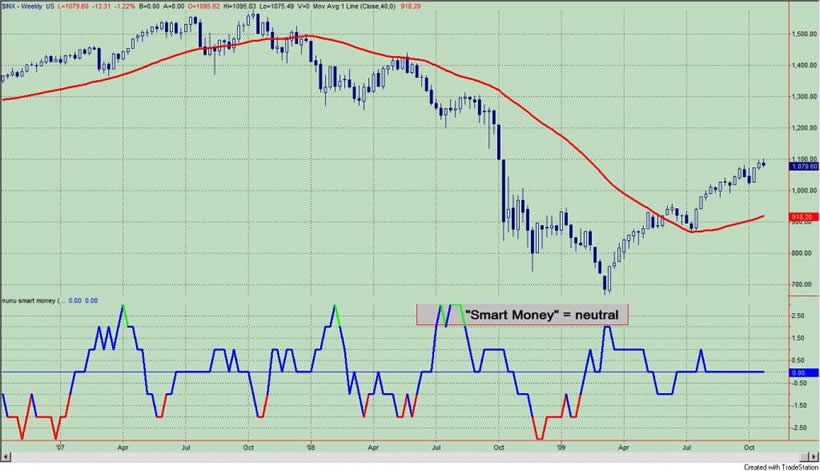
The "Smart Money" indicator is shown in figure 2. The "smart money" indicator is a composite of the following data: 1) public to specialist short ratio; 2) specialist short to total short ratio; 3) SP100 option traders. The "smart money" is neutral.
Figure 2. "Smart Money" Indicator/ weekly
Company insiders continue to sell shares to an extreme degree although selling has moderated due to earnings season. See figure 3, a weekly chart of the S&P500 with the Insider Score "entire market" value in the lower panel.
Figure 3. InsiderScore Entire Market/ weekly
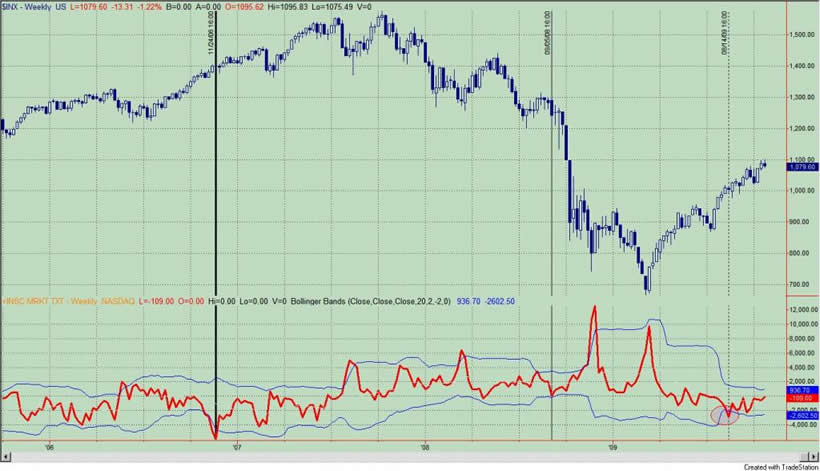
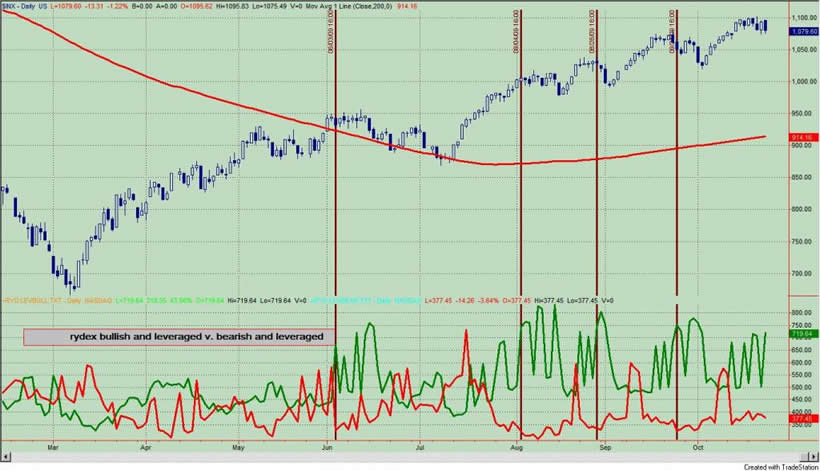
Figure 4 is a daily chart of the S&P500 with the amount of assets in the Rydex bullish and leveraged funds versus the amount of assets in the leveraged and bearish funds. Not only do we get to see what direction these market timers think the market will go, but we also get to see how much conviction (i.e., leverage) they have in their beliefs. Typically, we want to bet against the Rydex market timer even though they only represent a small sample of the overall market. As of Friday's close, the assets in the bullish and leveraged funds were greater than the bearish and leveraged by 1.91 to 1; referring to figure 4, this would put the green line greater than red line. When this ratio is greater than 2 the rally has generally stalled as noted by the maroon vertical lines.
Figure 4. Rydex Bullish and Leveraged v. Bearish and Leveraged/ daily
By Guy Lerner
http://thetechnicaltakedotcom.blogspot.com/
Guy M. Lerner, MD is the founder of ARL Advisers, LLC and managing partner of ARL Investment Partners, L.P. Dr. Lerner utilizes a research driven approach to determine those factors which lead to sustainable moves in the markets. He has developed many proprietary tools and trading models in his quest to outperform. Over the past four years, Lerner has shared his innovative approach with the readers of RealMoney.com and TheStreet.com as a featured columnist. He has been a regular guest on the Money Man Radio Show, DEX-TV, routinely published in the some of the most widely-read financial publications and has been a marquee speaker at financial seminars around the world.
© 2009 Copyright Guy Lerner - All Rights Reserved
Disclaimer: The above is a matter of opinion provided for general information purposes only and is not intended as investment advice. Information and analysis above are derived from sources and utilising methods believed to be reliable, but we cannot accept responsibility for any losses you may incur as a result of this analysis. Individuals should consult with their personal financial advisors.
Guy Lerner Archive |
© 2005-2022 http://www.MarketOracle.co.uk - The Market Oracle is a FREE Daily Financial Markets Analysis & Forecasting online publication.