


U.S. Economy, Investors Say No Worries Mate
Stock-Markets / Financial Markets 2009 Nov 07, 2009 - 01:30 AM GMTBy: Brian_Bloom

 The only way that this analyst can reconcile the (apparently optimistic) behavior of US investors with the (neutral to negative) underlying facts is that investors are emotionally “comfortable” with what the Bernanke/Geithner team is doing.
The following is a link to an article published today which reports that Fannie Mae is holding out its hand for a further US$15 billion in government aid. http://www.usatoday.com/money/economy/housing/2009-11-05-fannie-mae_N.htm
Quote: “Fannie Mae posted a quarterly loss of $19.76 billion, or $3.47 a share. The loss includes $883 million in dividends paid to the Treasury Department and compares with a loss of $29.41 billion, or $13 a share, in the year-ago period.”
The results were driven by $22 billion in credit losses as the company continued to build its reserves for sour mortgages.”
Quote: “And Fannie Mae cautioned: "We do not expect to operate profitably in the foreseeable future."”
Apparent investor reaction given today’s rise in the Dow Jones Industrial Index: No worries mate. Fannie Mae is breaking even before additional loan loss provisions. The worst is behind us. Everything’s cool.
The chart below – of Total US Consumer Credit Outstanding – can be argued by some to be a function of the way a Central Bank controlled economy works. In a fiat currency economy, debt is supposed to rise over time.
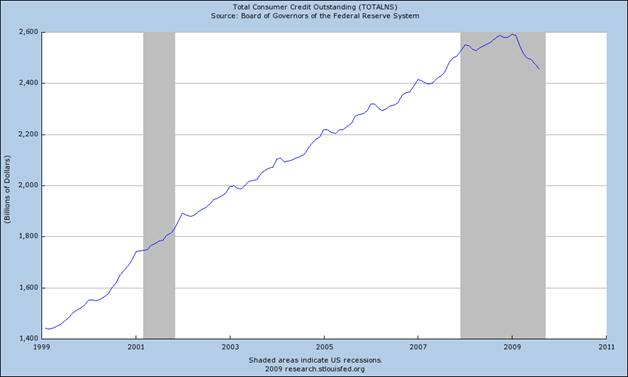
Source: http://www.thoughtofferings.com/2009/09/deflation-watch-august-price-level.html
Apparent investor reaction: No worries mate. Everything’s cool. US consumer debt is falling because consumers are paying off what they owe.
Analyst comment: Alternatively, consumer debt is falling because creditors like Fannie Mae are writing off the bad debts in the housing market and creditors like JP Morgan and Capital One have been charging off – and are preparing to charge off more - credit card debt.
Quote from an article on credit card delinquencies: "So far this year more than 2 million cases [of personal bankruptcy] have been filed, 49% more than the same period last year and eclipsing all previous records. ‘I think the actual magnitude really surprised some people," said Cynthia Ullrich, a director in the Fitch Ratings credit card group. "The feedback we received (from credit card issuers) is that it was larger than anticipated.’ Once a consumer files bankruptcy, lenders have 60 days by federal law to "charge off" the filer's accounts -- essentially recognizing that the debt is uncollectible and taking the loss. Fitch predicted the charge-off rate for major issuers could rise more than 30% to 7.5% in the next few months, compared with 5.7% of accounts currently.” (Source: http://articles.moneycentral.msn.com/Banking/BankruptcyGuide/BankruptcyLawBackfiresOnCreditCardIssuers.aspx published November 5th, 2009)
Apparent Investor attitude: No worries mate. Everything’s cool. China and India are taking over as the drivers of world economic growth.
Quote from OPEC October monthly report: “Non-OECD countries are now expected to make up 2.2 percentage points of world economic growth in 2010 with OECD contributing only 0.5%.”
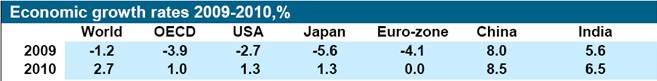
Source: http://www.opec.org..
Analyst comment: Unfortunately, by way of example, there’s a problem that OPEC analysts’ seem to have missed, and here it is in two steps:
Step 1: Have a look at the chart below:
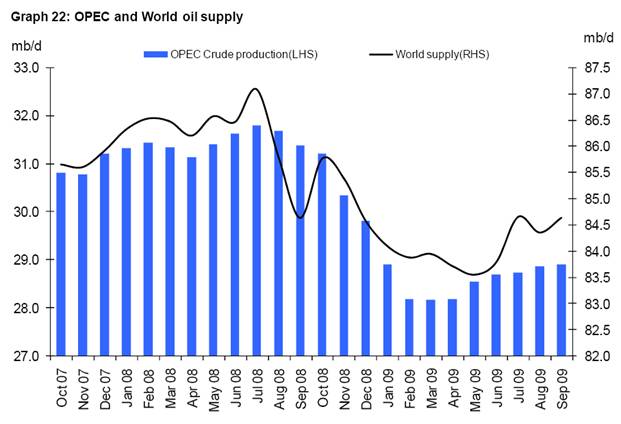
If we take the “bottom” of world supply at (say) 83.5 million barrels a day in May and we take the “top” at (say) 84.5 million barrels a day then the maximum cumulative increase in output for June through September is:
3 (months) X 30 (days) X 1 million barrels per day = 90 million barrels
Step 2: Validate what this means. Does a cumulative increase of 90 million barrels of supply signal an end to the recession?
Another quote from the OPEC report: “US commercial oil stocks resumed their upward trend, increasing 10.4 mb in September to stand at 1,109 mb, implying an overhang of nearly 90 mb.”
The conclusion one draws is dependent on how one views the numbers from a subjective point of view.
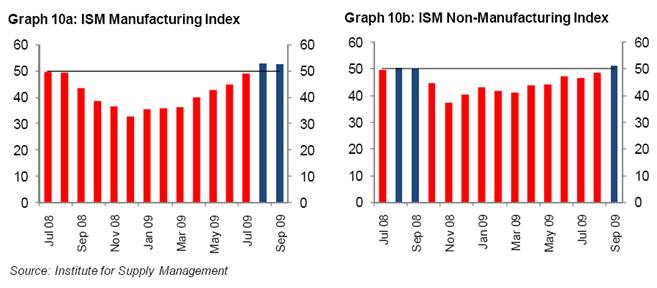
Another example: The two charts below – also from the OPEC report – show that, according to the Institute for Supply Management, both the manufacturing and non-manufacturing indices are hovering around the 50% level. The OPEC analysts seem to be drawing trend lines into the future to conclude that the perpendicular blue lines will rise in height, but there is no fundamental evidence to suggest that this conclusion is justified.
Question: What can we determine from all the above numbers?
Answer: Nothing.
If consumers drive the US economy then there is no evidence to suggest that their financial capacity to drive future growth in consumption is re-emerging. To the contrary growth in mortgage delinquencies and rising levels of insolvencies is showing the opposite. If oil drives the world economy then there is no evidence to suggest that growth is re-emerging. To the contrary, increased oil output is being offset by growth in oil inventories.
Of course, it is quite possible that the world is becoming less dependent on oil and that growth is expected to be driven by non-oil energy sources. But it is also quite possible that the “cash for clunkers” and other government stimulus programs caused the ISM charts to change from red to blue. All this is anecdotal and subject to personal interpretation.
Finally, let’s look at the equity markets in China and India – the two regions in the world that are being expected to drive world economic growth and which are not leading the world in energy technology development. (source: http://au.finance.yahoo.com/q/bc?s=000001.SS&t=my )
Chart A: China
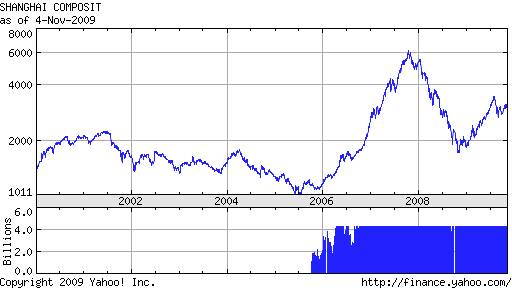
This chart is showing a series of falling tops. There is no sign of enthusiasm on the part of investors in Chinese equities notwithstanding anticipated growth within the Chinese economy of 8.5% in 2010 following an 8% expected growth in 2009.
Chart B: India
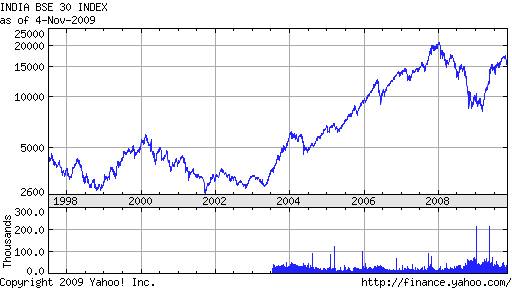
This chart has shown a buy signal when it broke above a falling trend line, but is still below its all time high notwithstanding anticipated growth of the Indian economy of 6.5% in 2010 following an expected 5.6% growth in 2009.
Conclusion
The “no worries mate” attitude of the world’s political leaders towards the state of the world economy in general is not defensible based on fact. The “no worries mate” attitude of investors in US equities markets in particular is not defensible based on fact.
Author Comment
The weekly chart of the US Dollar below is showing a “tentative” upward breakout (source: Decisionpoint.com)
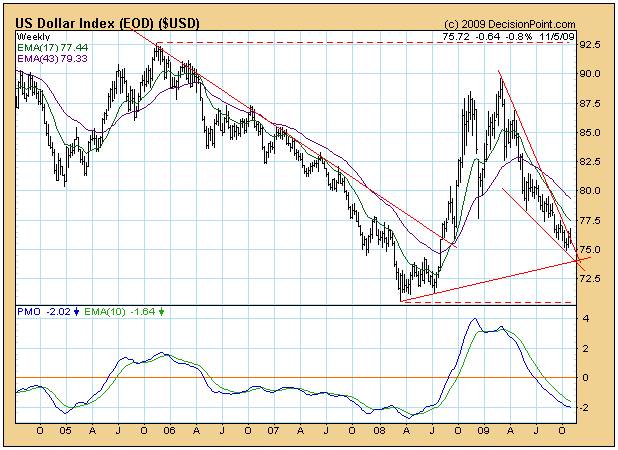
Of course, this might be a false breakout given that the dollar index has fallen back again in the past few days.
What interests this analyst greatly is the apparent lack of enthusiasm of investors for Chinese and Indian equities. With the dollar carry trade being facilitated by near zero short term interest rates in the USA one would expect “hot money” to be pouring into the Chinese and Indian equities markets given that the underlying economies are being forecast to grow so strongly in 2009 and again in 2010. What’s the risk?
Well, perhaps the risk lies in a perception by the more sophisticated investors that the US Dollar might rise and that investments in China and India might show capital losses because of currency fluctuations.
Why might the US Dollar rise? It makes no sense. The US Economy is on its knees. Who would want dollars?
Well, its early days yet, but the Point and Figure chart below of the 30 year treasury yield (courtesy stockcharts.com) has evidenced what is known as a “low pole reversal”. This indicates that, following a steep fall in the yield, the market has recovered lost ground and may be in the process of changing its mind. The formation manifesting on this chart may be characterized as a potentially bullish “flag” formation – which is a consolidation within a rising trend.
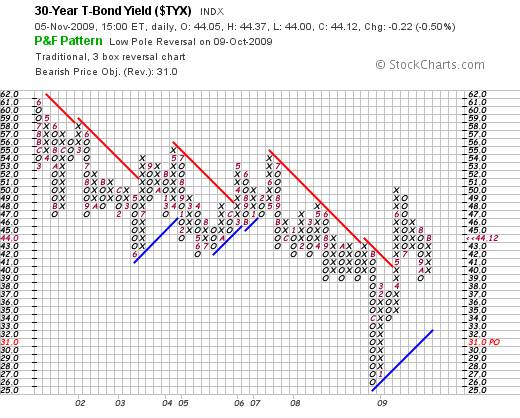
Could long dated yields in the USA be about to rise? If so, maybe money will come flooding back into the USA.
Questions: What will happen with that money? Where will it be invested?
Answer: If the dollars flooding back were in fact sold short in the first pace then nothing will happen. A surge in the US Dollar Index may be driven by nothing other than a squaring of the books – in the initial instance.
But if the US Dollar Index rises, this will hurt the domestic economies of both China and India. The US consumer is in no financial condition to step up consumption of goods and services produced by these two countries even if import prices fall. Further, a rising US$ index will cause the landed price of raw material imports in the growing countries to rise – thereby fuelling a rise in domestic costs of living; and thereby placing a downward pressure on economic growth in those countries. It will also put a damper on US exports.
The core issue, in this analysts view – which he has been repeating until he has been blue in the face – is that “energy” drives the world economy. Precisely how this happens is outlined in layman’s language in my recently published novel, Beyond Neanderthal, which can be ordered from www.beyondneanderthal.com
The chart below was originated by Dr Richard Duncan as part of his Olduvai Theory and is reproduced on page 258 of Beyond Neanderthal with Dr Duncan’s permission.
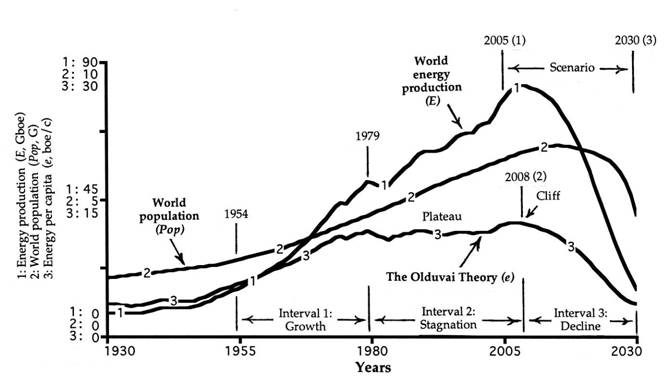
Let us take a brief look at the possibility that what this chart is anticipating might turn out to be correct and that energy output per capita across the planet might go into free fall.
The governments of the world – courtesy Mr. Al Gore – are now moving to lock in a concept known as Emissions Trading Schemes for the purpose of facilitating a concept called “Cap and Trade”. They will very likely do this at the upcoming Copenhagen talks. The cockamamie logic of this cap and trade argument is that if the emissions of CO2 polluters are capped but they can still find a loophole by buying other people’s rights to produce carbon, then no worries mate, everything will be cool.
Unfortunately, the people who invented the cap and trade logic were not so much interested in the “capping” element of the cap and trade argument. Rather they were interested in the “trading” element – as evidenced by the article below:
http://community.nasdaq.com/News/2009-11/The-carbon-market-is-coming,-and-it-will-be-huge.aspx
Quote: “…the carbon trading market, which has grown from a $100 million market in 2003 to a $400 million market now, is bound to hit $1 trillion in the next few years, according to panelists on the "Emerging Asset Classes" presentation on day two of the Global Financial Leadership Conference.”
Others who will benefit from the Cap and Trade policy are: Existing polluters, lawyers, bankers, financial advisers, accountants, speculators and, theoretically, producers of emerging energy technologies who will receive incomes after all the aforementioned have had their snouts in the ETS trough. Quite simply, the Cap and Trade and its associated Emissions Trading Schemes do not pass the common sense tests.
Logically – and given the now clear certainty that neither solar nor wind energy nor anything else on the horizon can provide a “base-line” energy supply, there is only one way that the world can reposition itself to become less dependent on Neanderthal fire, and that is to look to Albert Einstein’s e=mc2 formula. To quote from Einstein’s original thesis which was originally published on September 27th 1905: “If a body gives off the energy L in the form of radiation, its mass diminishes by L/c².”
However, in this analyst’s understanding, there may be TWO ways to convert the mass that exists within the nucleus of an atom into energy. The first and most obvious way is by nuclear fission – by bombarding the nucleus of certain types of atoms with neutrons which, in turn, can give rise to a chain reaction under certain conditions thereby releasing both usable energy and potentially dangerous (but arguably manageable) amounts of biologically damaging radiation. Beyond Neanderthal examines the possibility of an alternative, non destructive approach which, according to conventional laws of physics is impossible. The fact is that the claims of inventors in this particular field have been neither proven by the protagonists nor disproven by the skeptics. From this analyst’s perspective, the question is still open and is certainly deserving of further disciplined investigation.
Having said this, let’s proceed from the assumption that nuclear fission may be the way to go – which will be the theme of my next novel. The fact is that a nuclear fission plant takes upwards of a decade to build because of all the legal red tape that exists. Right now, 39% of the world’s electricity is being generated by coal fired power stations (source: Power to Save the World, Cravens, Alfred A. Knopf, 2008). Right now, the largest single contributor of carbon emissions to the environment is coal fired power stations. Right now, only countries like China and India are seriously contemplating the construction of yet more coal fired plants even though several seem to be in the pipeline in the USA. Right now, our political leaders are playing games which are focusing more on trading carbon emissions than on coordinating an approach to finding an alternative source of “base-load” energy.
So, dear reader, if you think that the world economic problems are behind us and that the US stock market has entered a new Primary Bull market, then I wish you the best of luck. If you think that a move to a gold standard is going to address the issues that are implicit in Richard Duncan’s chart above, then I wish you the best of luck. However, if you seriously want to face the future with a problem solving turn of mind, then I recommend that you buy several copies of Beyond Neanderthal – which can be ordered via the web link below – and give them to all your friends as Christmas presents. There are some who will argue – myself included – that the world economic raft, courtesy Mr. Al Gore and the IPCC, is about to hit white water. The case is made in Beyond Neanderthal that we will be able to survive to face a better future.
By Brian Bloom
Once in a while a book comes along that ‘nails’ the issues of our times. Brian Bloom has demonstrated an uncanny ability to predict world events, sometimes even before they are on the media radar. First he predicted the world financial crisis and its timing, then the increasing controversies regarding the causes of climate change. Next will be a dawning understanding that humanity must embrace radically new thought paradigms with regard to energy, or face extinction.
Via the medium of its lighthearted and entertaining storyline, Beyond Neanderthal highlights the common links between Christianity, Judaism, Islam, Hinduism and Taoism and draws attention to an alternative energy source known to the Ancients. How was this common knowledge lost? Have ego and testosterone befuddled our thought processes? The Muslim population is now approaching 1.6 billion across the planet. The clash of civilizations between Judeo-Christians and Muslims is heightening. Is there a peaceful way to diffuse this situation or will ego and testosterone get in the way of that too? Beyond Neanderthal makes the case for a possible way forward on both the energy and the clash of civilizations fronts.
Copies of Beyond Neanderthal may be ordered via www.beyondneanderthal.com or from Amazon
Copyright © 2009 Brian Bloom - All Rights Reserved
Disclaimer: The above is a matter of opinion provided for general information purposes only and is not intended as investment advice. Information and analysis above are derived from sources and utilising methods believed to be reliable, but we cannot accept responsibility for any losses you may incur as a result of this analysis. Individuals should consult with their personal financial advisors.
Brian Bloom Archive |
© 2005-2022 http://www.MarketOracle.co.uk - The Market Oracle is a FREE Daily Financial Markets Analysis & Forecasting online publication.