


Stock Market Investment Sentiment, Changes Within The Indicators
Stock-Markets / Stock Market Sentiment Nov 08, 2009 - 04:05 PM GMTBy: Guy_Lerner

 Every week that I put together these comments, I pay great attention to the words that I write. Last week's key points were: 1) the range continues; 2) seasonal tendencies and being at the bottom of a well defined trend channel argue for a bounce; 3) we need to see the excesses of bullish sentiment unwound before we have meaningfully higher prices; 4) the risk of a market down draft remains great. This week investor sentiment has become very convoluted suggesting even greater care in the words I choose. So let's get to it.
The "Dumb Money" indicator, which is shown in figure 1, looks for extremes in the data from 4 different groups of investors who historically have been wrong on the market: 1) Investor Intelligence; 2) Market Vane; 3) American Association of Individual Investors; and 4) the put call ratio. The "Dumb Money" indicator shows that investors are extremely bullish.
Figure 1. "Dumb Money" Indicator/ weekly
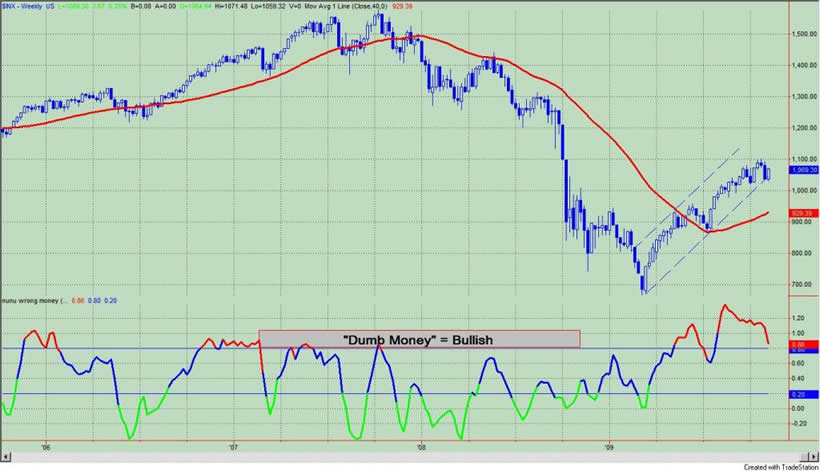
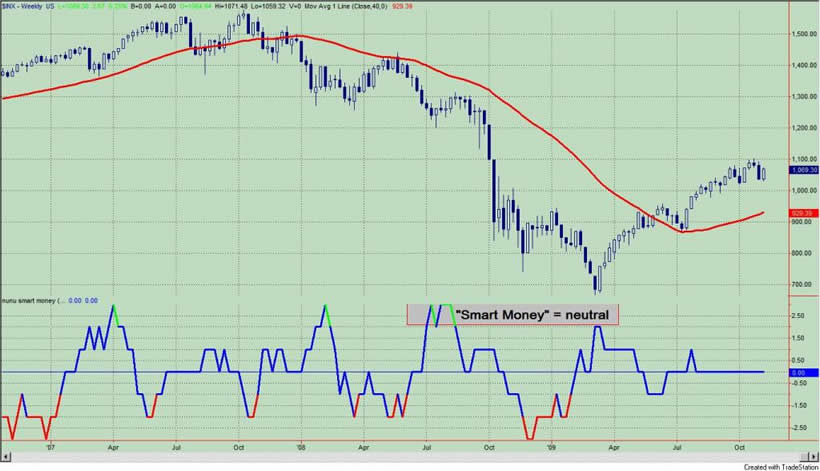
With regards to the "Dumb Money" indicator there is no change. Investors remain bullish to an extreme. This implies a trading range with an upward bias until the excesses of bullish sentiment are unwound. However, the American Association of Individual Investors data, which is one of the components of the "Dumb Money" indicator, has turned decidedly negative on the market, and typically, this bearish stance is a bullish signal. In fact, as we can see in figure 2, their bearishness is at levels seen just prior to the market's lift off in July of this year.
Figure 2. AAII/ weekly
The "Smart Money" indicator is shown in figure 3. The "smart money" indicator is a composite of the following data: 1) public to specialist short ratio; 2) specialist short to total short ratio; 3) SP100 option traders. The "smart money" is neutral. There is no change in the "Smart Money" indicator.
Figure 3. "Smart Money" Indicator/ weekly
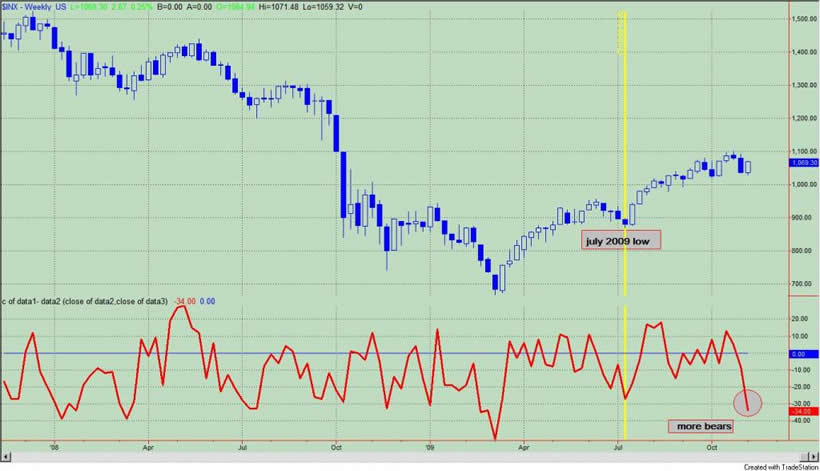
Figure 4 is a weekly chart of the S&P500 with the InsiderScore "entire market" value in the lower panel. What we notice is that the value is moving above the upper trading band. Moves above this level are considered bullish, and in fact, this is the highest level of insider buying in about 6 months. However, buying wasn't broad based or significant, and outside of the financial sector, "there was only a modest deviation in sentiment week-over-week towards a less bearish stance." In other words, "bullish signals weren't backed up by actual transactions."
Figure 4. InsiderScore Entire Market/ weekly
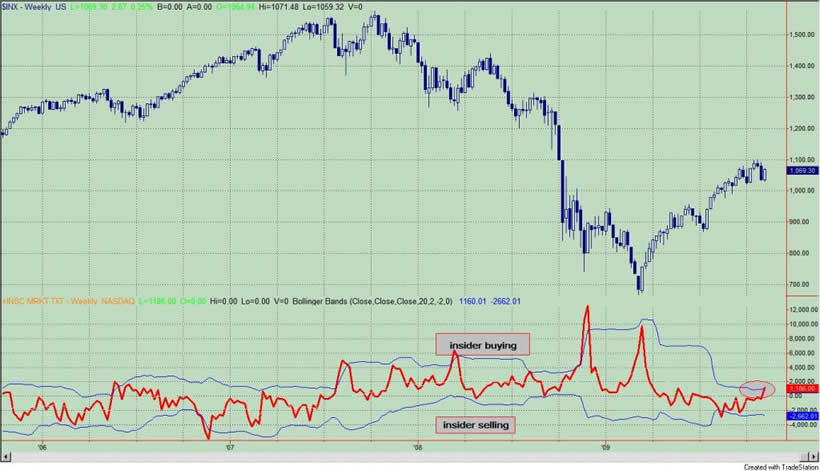
Figure 5 is a daily chart of the S&P500 with the amount of assets in the Rydex bullish and leveraged funds versus the amount of assets in the leveraged and bearish funds. Not only do we get to see what direction these market timers think the market will go, but we also get to see how much conviction (i.e., leverage) they have in their beliefs. Typically, we want to bet against the Rydex market timer even though they only represent a small sample of the overall market. As of Friday's close, the assets in the bearish and leveraged funds were greater than the bullish and leveraged; referring to figure 5, this would put the red line greater than green line.
Figure 5. Rydex Money Market/ daily
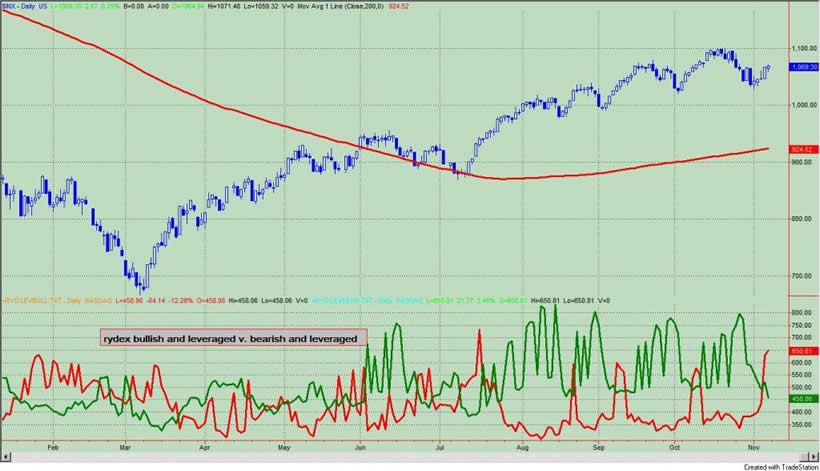
However, when we look at the entire Rydex data more closely, we note that the amount of assets in the Rydex Money Market Fund remains very low and this is a sign of greed. Typically, when the Rydex market timers move to a bearish and leveraged position as they are now, we see money coming out of the market (or moving to the sidelines) to the safety of the money market fund. We don't have that now. The Rydex market timers appear to be both bearish and bullish, which is quite unusual.
So where do we stand? I don't like to massage the data nor rationalize the signals given by the indicators, and I won't do that here. The sum of the data would suggest that the words that I have been stating for the past 4 weeks still apply:
"Equities are for renting not owning at this juncture. I am not calling for a market top, but prices should trade more in a range, and if you intend to play on the long side, it will be important to maintain your discipline (for risk reasons) and buy at the lows of that trading range and sell at the highs to extract any profits from this market. The upward bias still remains as long as investor sentiment is still extremely bullish, but there is probably greater risk of a market down draft now than in past weeks."
The changes within the indicators are noteworthy, but there is still nothing noteworthy regarding the indicators.
Over the past week, the expected bounce has materialized and the market is now short term overbought. Will the bulls have the necessary fire power to break the trading range? While certain aspects of the sentiment data would suggest that this is possible, the sum of the data tells me that very little has changed.
By Guy Lerner
http://thetechnicaltakedotcom.blogspot.com/
Guy M. Lerner, MD is the founder of ARL Advisers, LLC and managing partner of ARL Investment Partners, L.P. Dr. Lerner utilizes a research driven approach to determine those factors which lead to sustainable moves in the markets. He has developed many proprietary tools and trading models in his quest to outperform. Over the past four years, Lerner has shared his innovative approach with the readers of RealMoney.com and TheStreet.com as a featured columnist. He has been a regular guest on the Money Man Radio Show, DEX-TV, routinely published in the some of the most widely-read financial publications and has been a marquee speaker at financial seminars around the world.
© 2009 Copyright Guy Lerner - All Rights Reserved
Disclaimer: The above is a matter of opinion provided for general information purposes only and is not intended as investment advice. Information and analysis above are derived from sources and utilising methods believed to be reliable, but we cannot accept responsibility for any losses you may incur as a result of this analysis. Individuals should consult with their personal financial advisors.
Guy Lerner Archive |
© 2005-2022 http://www.MarketOracle.co.uk - The Market Oracle is a FREE Daily Financial Markets Analysis & Forecasting online publication.