Gold GLD and Silver SLV ETFs Forecast Updates
Commodities / Gold & Silver 2009 Dec 07, 2009 - 02:49 AM GMTBy: Piazzi
 The last time I wrote about GLD and SLV, November 21, I said this about GLD
It may be a bit extended for new positions as it is quite a bit of distance from all of its MAs. If the current count is correct, GLD may be near the end of its Intermediate wave 3, or that wave may be extending
And
Weekly price has started a vertical ascent, which is supportive of the bullish count and the notion of an intermediate degree 3rd wave. But the vertical nature of the past few weeks, and the high volume bars, make me a bit nervous that we may have a buyer exhaustion setting in soon.
And this about both metals
I’d rather be cautious and try to protect what I might have built in for now.
That was two week ago. At the time SLV was at 18.22, and GLD was at 112.94. Since then, SLV rose to an intraday high of 19.11 and GLD to an intraday high of 119.54. This Friday, SLV closed at 18.15, and GLD at 113.75. In the same post, I said that I had a target of 116.50 for GLD and 19.20 for SLV
So, it seems like it was not bad thing to avoid new positions, to take care of existing positions, and to have some well-calculated target areas in mind as our guides.
We did all that by just following our charts, applying finely tuned technical measures, and mainly ignoring expert opinions offered by main stream financial media. The past is the past. We gladly take credit for a job well done. We move on, and ask the only relevant question:
What about now?
This is a daily chart of GLD
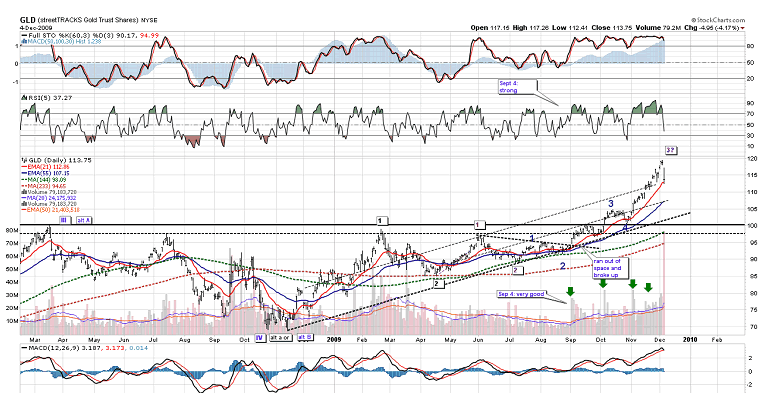
Look at the volume on Friday. You probably have heard many stories. Like dollar’s on the rise. FED is about to drain liquidity. Job numbers were good,. ETC, ETC. They all may be right or not, relevant or not. Still, not many told us that we had a wave structure that looked about complete. We had an issue that looked seriously extended on daily and weekly frames. We had everybody talking about precious metals and currency problems. Not many told us that we had a situation where PM miners were not doing all that much better than gold. I do believe that in a healthy commodity environment, the commodity producers should do better than the commodity itself. And by that I mean broadly across the group.
GLD may very well have entered a correction that might lead to a trend change. If the overall structure of the above count is correct, we may have seen the end of Intermediate wave 3. Only a new high would invalidate that possibility.
To the downside, only an overlap with the Intermediate wave 1 (purple) would put the current count under suspicion. Those are very poor trade parameters because they cover a wide range from 95 to 120. Not only that, shorting GLD now, exposes the shorter to some 8-10% risk before the tightest stop is hit.
Still, operating within the premises of the current count, and assuming that we have seen the end of Intermediate wave 3, if I wanted to narrow things a little, I could argue that due to the strength of the Minor wave 5 of Intermediate wave 3, we have a good probability for the correction to be at most limited to the area of Minor wave 4, that is, 101-104. That would be about 50-62% retracement of Intermediate wave 3.
GLD hit a high of 119+ which comes close to 2.62 * Intermediate wave 1.
Timewise, Intermediate 3 took 1.62 * the time taken for Intermediate 1 + Intermediate 2. If I project a 2.62 extension of the time of Intermediate 1 + Intermediate 2, it will give sometime early in March, 2010. That time frame corresponds with a seasonal period of strength that runs from March to July.
So, there it is, my first crack at projecting things assuming that
- My overall count is correct
- We have seen the end of Intermediate wave 3
I have seen bearish wave counts for gold that argue that the advance since the lows of 2008 is a wave B up – to be followed by a wave C down type of crash.
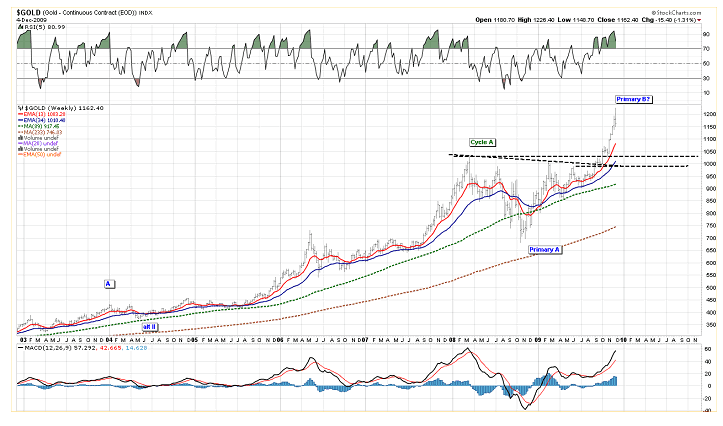
That would make a hell of a wave B. Maybe they are right, but it just doesn’t cut it for me right now.
It doesn’t matter, really. They expect a crash, I expect a correction, so, if either party is right, we should see lower prices, we’ll then re-evaluate as waves unfold.
This is a weekly with both my counts and the bullish one being the preferred count
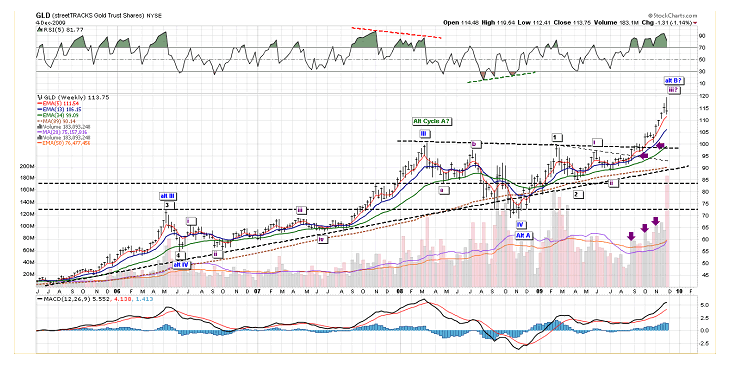
Some of you may remember when I was talking about the triangular range around 95, and the breakout to the upside. Then we started talking about a possible Inv H&S and we were saying that if gold wanted to go, it just had to go, no dilly-dally, if-but-maybe-this-maybe-that; just break out on good volume and go, and it did that.
And that, to me, is the essence of market participation. One sees a setup, defines one’s conditions and parameters, and acts.
Now the 100 level on GLD, or 1000 on gold is a must hold. But, before that, we have the top of Intermediate wave 1 (purple) that should ideally not be overlapped if my preferred count is correct
--------------------------------------------------------------
For SLV My target prices did very well. Because silver did not have the vertical ascent of gold, I lasted a bit longer before taking whatever defensive measures I deemed necessary.
This is a daily chart of SLV
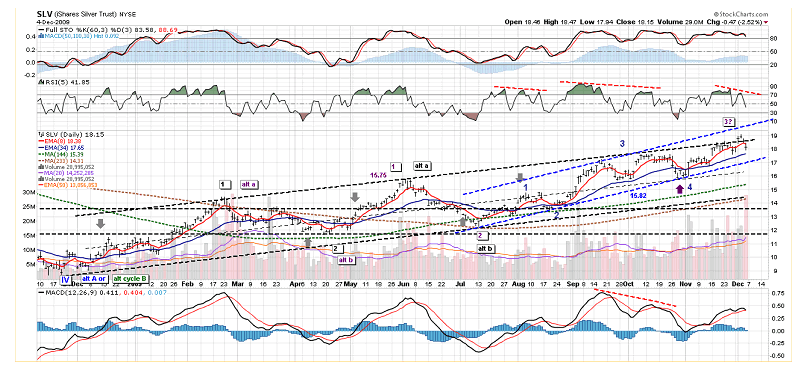
Same story as gold. It looks done, or almost done, and if the count is correct, a correction to the area of minor wave 4 (16 – 17.5) is a likely target at this point.
I need to remind you that even if we have topped, we are so early that I am just doing ballparks.
Silver’s high point came at Intermediate 3 = 1.62 * intermediate 1.
It took intermediate 3 about 1.62 * time taken for (Intermediate 1 + Intermediate 2), and if I project an Intermediate 4 at 2.62 * (Intermediate 1 + Intermediate 2), It gives me end of February 2010, which is basically the same as what I projected for gold.
Once again, all targets and projections are theoretical. For price projections, it is an area that I seek not a pin point, and for time projections, it is a period that I seek and not the exact second of some big bang event.
So far, Gold has been a leader, and that, IMO, is not a very desirable situation to have for a long lasting PM bull environment. Maybe things have changed. But I still think that in a good PM environment those with more leverage to the price of the metal should lead. So if my count is correct and there is a major wave 3 and an Intermediate wave 3 to come, at so point miners, especially the juniors, should do very, very well. So, keep an eye on the performance of seniors versus gold, and juniors versus seniors.
Also, if this thing is for real, silver may do a lot better in terms of performance as the PM bull ages.
This is a weekly chart of SLV
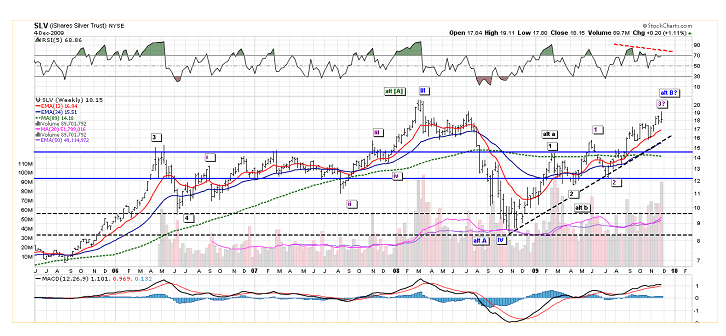
What happened on Friday served as a reminder of what I always say to keep myself alert:
The doors of crowded places are narrow and few.
Have a Nice Day!
By Piazzi
http://markettime.blogspot.com/
I am a self taught market participant with more than 12 years of managing my own money. My main approach is to study macro level conditions affecting the markets, and then use technical analysis to either find opportunities or stay out of trouble. Staying out of trouble (a.k.a Loss) is more important to me than making profits. In addition to my self studies of the markets, I have studied Objective Elliott Wave (OEW) under tutorship of Tony Caldaro.
© 2009 Copyright Piazzi - All Rights Reserved Disclaimer: The above is a matter of opinion provided for general information purposes only and is not intended as investment advice. Information and analysis above are derived from sources and utilising methods believed to be reliable, but we cannot accept responsibility for any losses you may incur as a result of this analysis. Individuals should consult with their personal financial advisors.
© 2005-2022 http://www.MarketOracle.co.uk - The Market Oracle is a FREE Daily Financial Markets Analysis & Forecasting online publication.


