


ETFs Yielding More than 3% With Liquidity and Size
Companies / Investing 2010 Dec 22, 2009 - 04:27 PM GMTBy: Richard_Shaw

 We are in a yield hungry world. Here is a list of the 66 of 861 ETFs that yield over 3% and also trade over $1 million per day and have at least $100 million in market-cap as of December 14, 2009.
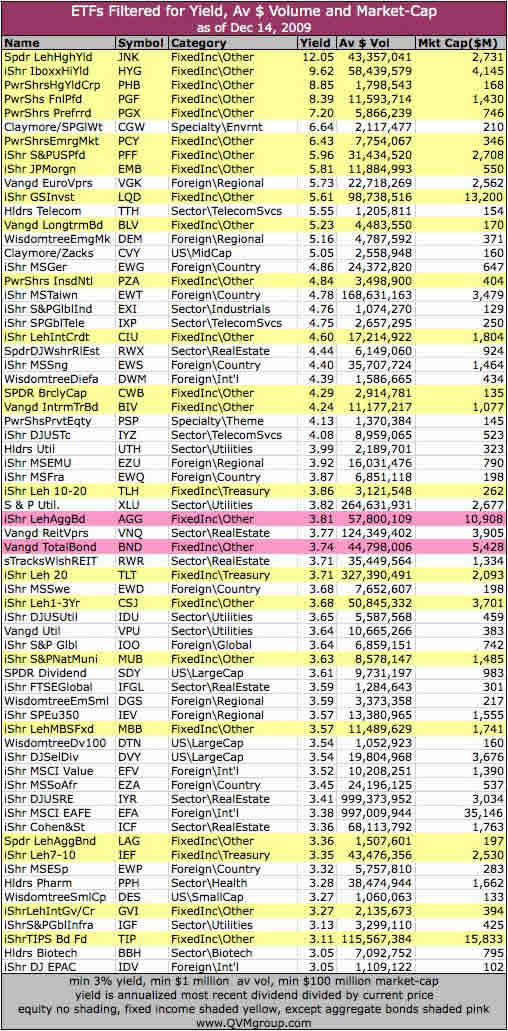
Yield for this filter is the annualized most recent dividend payment as calculated by VectorVest.
The values for AGG and BND are highlighted in pink as “central values” representing US aggregate bonds. Fixed income funds are highlighted in yellow. Equity funds are not highlighted.
Notably absent from the the filtered list are key funds such as:
- DIA (Dow 30 large-cap)
- SPY (S&P 500 large-cap)
- MDY (S&P 400 mid-cap)
- IWM (Russell 2000 small-cap)
- EEM and VWO (MSCI emerging markets)
- EWZ (Brazil)
- FXI (China)
The filtered does not suggest that higher yielding stocks will have higher total returns than lower yielding stocks. It expresses no opinion on that question. It does identify those stocks that are producing above average dividend cash flow and that have certain minimum liquidity and market-cap.
The list raises the question of relative long-term value of certain equity funds versus certain bond funds.
For example, if a utilities fund (such as XLU) has the same or slightly higher yield as aggregate bond funds (such as AGG or BND), perhaps moving some money from the aggregate bond fund to the utility fund could improve long-term cash flow, because the cash flow from the utility may be more likely to rise than the cash flow from the bond fund.
Further, if a dividend oriented fund (such as SDY, the S&P Dividend Aristocrats) pays nearly as much dividend yield as an aggregate bond fund, perhaps some reallocation from aggregate bonds to the dividend fund could increase long-term portfolio cash flow.
Of course, moving assets from bonds to stocks, even for yield, will likely increase portfolio volatility, but for some investors, volatility is not such a big worry if the dividend cash flow keeps coming in.
There are risk/reward trade-offs to be considered, but the starting point is the data.
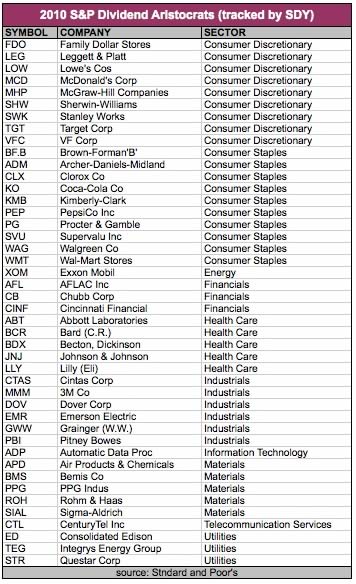
You can look-up the composition of XLU in many places, and that is unlikely to change much. However, the criteria for SDY are such that companies do flow into and out of the S&P Dividend Aristocrats index, particularly with the devastation of last year. GE, PFE and 8 others got bumped, because they cut their dividends. One was deleted due to acquisition and 2 new were added. The Aristocrats criteria are S&P 500 membership and 25 years of back-to-back full year dividend increases. Here is the list S&P has announced for 2010, ordered by sector:
Due Diligence Shop Talk:
Note that annualized last distribution is not always the best method of comparing funds, particularly if the distributions from period-to-period vary substantially, as is common among international funds, for example.
The initial challenge investors face with databases is that each tends to use one method or the other to calculate yields for all funds, regardless of specific suitability. Databases are only a first step. Manual research must follow to invest knowledgeably.
Critical Note: We have not individually verified the accuracy of the data for each fund in this list. The data came from a commercial data service. Yield data is particularly prone to inaccuracies and difference between data services. The data in this list is not warranted to be correct. Be sure to verify any data for yourself, fund-by-fund.
Key reasons for yield data inaccuracies or database differences include:
- whether the yield is based on 12-month trailing dividends, annualized most recent dividend, annualized indicated next dividend, or SEC yields;
- whether the frequency multiplier is appropriately selected per fund (e.g. times 12, times 4, times 2 or times 1);
- whether the distributions on which the calculations are based are essentially out of date (e.g. 12-mo trailing dividends when dividends are rising or falling at a significant rate);
- whether the reported dividends include only interest and dividends received from the underlying portfolio, or whether it includes some capital gains or return of capital.
Further to item #3, consider this example: VWO, the Vanguard emerging market fund pays 1 time per year (unless there is special supplemental). Last December it paid about $1.18 in dividends on a trailing 12-month basis (no capital gains or losses). This year, Vanguard estimates the dividend to be $0.49 on a trailing basis (no capital gains or losses). Annualizing the last paid distribution would give a radically different view of yield than annualizing the projected trialing amount to be distributed in a matter of days. Dividend yield discovery is not as straight forward as price discovery, which is right out front all of the time.
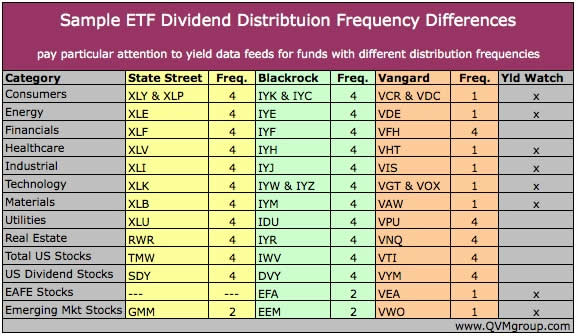
This table comparing selected funds from State Street, Blackrock and Vanguard illustrates that the frequency of distribution for funds of the same category are not necessarily the same — pointing to the need when working manually to be aware of distribution frequency.
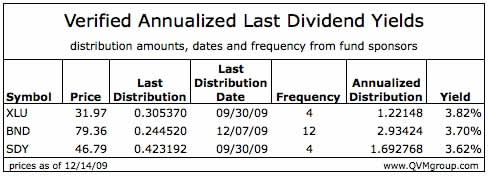
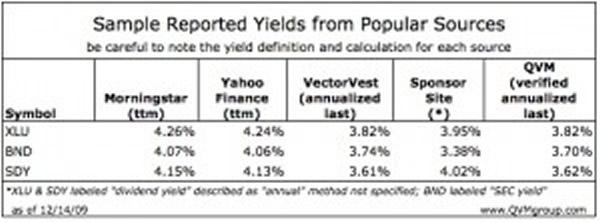
Specific Due Diligence: We did verify the annualized yield based on last distribution for BND, XLU and SDY, which we singled out as examples in this report.
Here is the detail of the verification we performed with data from the sponsor sites.
The next chart shows the yield you will find at several popular sources, with a comparison to the manually verified annualized last dividend for the three funds we verified above. You can see that the data vary significantly.
We’ve gone to this extreme in documenting yields to illustrate the financial significance of carefully investigating data sources, and of manually cross checking data before making yield oriented investment decisions.
Compliance Disclosure:
In the aggregate, we currently own JNK, HYG, EMB, VGK, LQD, XLU, AGG, BND, MUB, SDY, DVY, EFA, SPY, EEM, VWO, EWZ, and FXI in some but not all managed accounts. We do not currently own other mentioned securities. We are a fee-only investment advisor, and are compensated only by our clients. We do not sell securities, and do not receive any form of revenue or incentive from any source other than directly from clients. We are not affiliated with any securities dealer, any fund, any fund sponsor or any company issuer of any security.
This report is for informational purposes only, and is not personal investment advice to any specific person for any particular purpose. We utilize information sources that we believe to be reliable, but do not warrant the accuracy of those sources or our analysis. Past performance is no guarantee of future performance. Do not rely solely on this research report when making an investment decision. Other factors may be important too. Consider seeking professional advice before implementing your portfolio ideas.
By Richard Shaw
http://www.qvmgroup.com
Richard Shaw leads the QVM team as President of QVM Group. Richard has extensive investment industry experience including serving on the board of directors of two large investment management companies, including Aberdeen Asset Management (listed London Stock Exchange) and as a charter investor and director of Lending Tree ( download short professional profile ). He provides portfolio design and management services to individual and corporate clients. He also edits the QVM investment blog. His writings are generally republished by SeekingAlpha and Reuters and are linked to sites such as Kiplinger and Yahoo Finance and other sites. He is a 1970 graduate of Dartmouth College.
Copyright 2006-2009 by QVM Group LLC All rights reserved.
Disclaimer: The above is a matter of opinion and is not intended as investment advice. Information and analysis above are derived from sources and utilizing methods believed reliable, but we cannot accept responsibility for any trading losses you may incur as a result of this analysis. Do your own due diligence.
Richard Shaw Archive |
© 2005-2022 http://www.MarketOracle.co.uk - The Market Oracle is a FREE Daily Financial Markets Analysis & Forecasting online publication.