


Migrating to New Energy Paradigms Part 2 - The Economic Importance of Crude Oil
Commodities / Crude Oil Jul 24, 2007 - 01:54 AM GMTBy: Brian_Bloom

Peak Oil is defined as the point at which 50% of the world's oil reserves have been consumed, and 50% remain. We all understand that oil is important to the world economy, but just how important is it?
In October 2004 I attempted to answer this question on behalf of a client as part of that client's long range strategic planning process. The amount of work involved was fairly significant so I have chosen to rely on my findings of that time for the purposes of this article. There are two other reasons:
- The purpose here is to communicate a principle. Updating the data will not change the principle, which is this: We need to move away from our dependence on oil as soon as is humanly possible – certainly within a decade at the absolute latest.
- Looking back into history, we can see just how important the conclusions of that exercise turned out to be. In hindsight, as things have turned out, I was hitting the bull's eye. I am therefore highly confident that what you will read below is very close to the truth.
The world economy “appears” to be booming at present. That is what the politicians would have us believe. To the contrary, I believe that what we are seeing is the lipstick on the pig. Monetary inflation is driving an ageing cycle of world economic growth, and – because the politicians are lying about the underlying CPI inflation rate – it appears that this growth is real.
It is not real. Those who we elected as our representatives, to look after our interests, have lost the plot. Crazed by their own egomaniacal needs for self aggrandisement, they have been leading us down a path of destruction. Recognising this fact will represent a first step towards healing, and towards fixing the damage that has been wrought. To put it bluntly: If we fail to recognise this, and we fail to take appropriate action, we run the risk of runaway inflation and a final – and terminal – collapse of the world economy. This may sound melodramatic, but I believe it to be true, for reasons that will be presented in this series of articles.
The primary purpose of these articles is to deliver a message of hope; to present an argument (a strategy if you like) regarding what we might do about these economic problems which are manifesting as a direct result of Peak Oil, so that we might avoid this terminal collapse.
The complete and integrated story is complex, starting with mathematical evidence that the ecological environment is really a dynamic biological organism which pulsates with a life of its own. The chart below is reproduced from an article written by Cesare Marchetti, which appeared in the May 8 th 1985 edition of New Scientist Magazine.
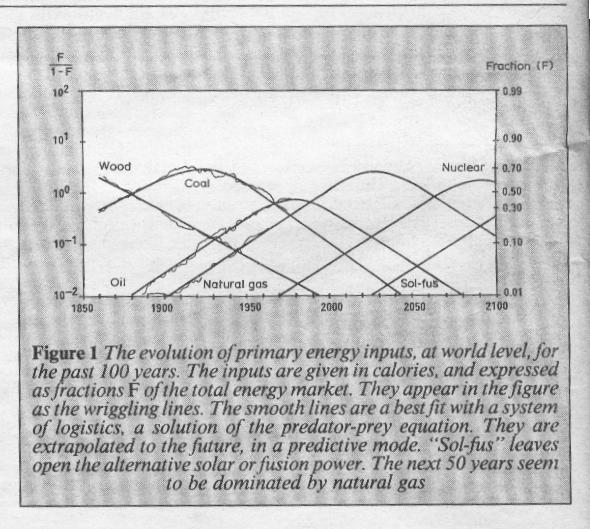
The solid lines in the above chart were derived from mathematical modelling, whilst the squiggly lines were actual data. Even the untrained eye can see an extraordinarily accurate fit. Unfortunately, via a process of biofeedback, the decision makers in society have interfered with this biological process since then, but the historical fit is remarkable. The probability of coincidence is vanishingly small.
As a non scientist, what captured my imagination at the time was that the model was derived by Marchetti from a set of equations called the “Volterra Lotka” equations. “The competitive Lotka-Volterra equations are a simple model of the population dynamics of species competing for some common resource ”. ( Source: http://en.wikipedia.org/wiki/Competitive_Lotka-Volterra_equations )
Originally developed in the 1920s, these equations modelled the interplay between buck and wolves in a forest. The wolves feed off the buck. As the buck population depletes, its ability to sustain the wolf population wanes, causing the wolf population to deplete. In turn, this allows the buck population to replenish again; and the cycle repeats. What I found awe inspiring at the time was that the chart above provided raw proof that the energy market (a subset of our ecological environment) had been behaving according to a dynamic biological rhythm of nature. Drawing a long bow of analogy, just as the beehive has a discrete identity which is symbiotically intertwined with the lives of the individual bees which populate it, this model demonstrated that the ecology has a discrete identity which is symbiotically intertwined with the humans who populate it.
Although I am not an economist I did study economics at University and, when I read the article in which the above chart appeared, I was reminded of an economist by the name of Joseph Schumpeter (1883-1950).
“ Schumpeter believed that capitalism would be destroyed by its successes. Capitalism would spawn, he believed, a large intellectual class that made its living by attacking the very bourgeois system of private property and freedom so necessary for the intellectual class's existence. And unlike Marx, Schumpeter did not relish the destruction of capitalism. He wrote: "If a doctor predicts that his patient will die presently, this does not mean that he desires it."
Capitalism, Socialism, and Democracy [authored by Schumpeter] was much more than a prognosis of capitalism's future. It was also a sparkling defence of capitalism on the grounds that capitalism sparked entrepreneurship. Indeed, Schumpeter was among the first to lay out a clear concept of entrepreneurship. He distinguished inventions from the entrepreneur's innovations. Schumpeter pointed out that entrepreneurs innovate, not just by figuring out how to use inventions, but also by introducing new means of production, new products, and new forms of organization. These innovations, he argued, take just as much skill and daring as does the process of invention.
(Source: http://www.econlib.org/Library/Enc/bios/Schumpeter.html )
Knowing this, I was humbled by the following chart which is also reproduced from Marchetti's article.
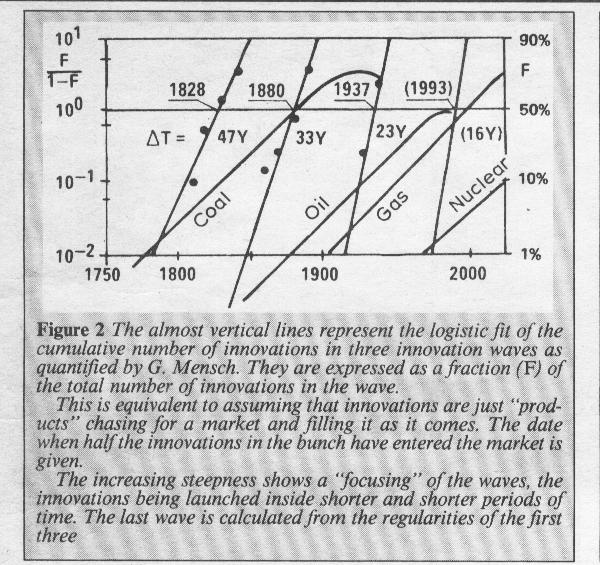
This chart overlays onto the first chart the emergence of (entrepreneurial) innovations as represented by the number of patents registered at the patent offices – and yet another fascinating fact manifests: At the point that the median of the chart of the new wave of innovations intersects the chart of the newly emerging energy wave, the world economy begins to take on a new vibrancy.
One foundational facilitator of economic activity is transport. Without transport, your lettuces, as an example, will not be able to be delivered from the farms to the supermarkets, as James Dean dramatically demonstrated in one of his classic movies. Thus, an implication of the above chart is that one foundational cornerstone on which the emerging wave of energy related innovations is predicated, will be new ‘modes of transport'. The following chart validates this observation:
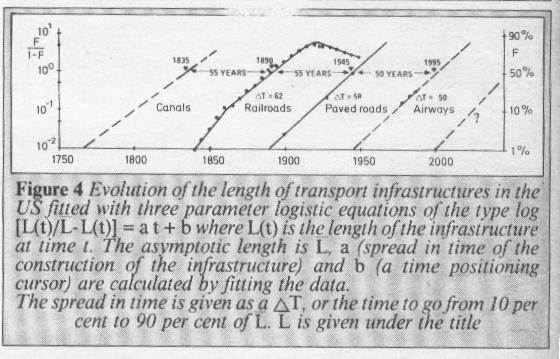
There will be those amongst the readers of this article who will remember the name “Kondrat'eff”. He was a Russian economist who postulated that the world economy pulsated to a 55 year beat. This latter chart demonstrates that he was substantially correct – that is, until the Central Bankers got it into their arrogant heads that they could manage the forces of Nature.
Interim conclusion:
Emerging energy paradigms drive technological innovations by entrepreneurs, which, as a consequence of their commercialisation and market penetration drive the world economy.
Armed with this understanding, we see that the US's (and Australia's) failure to ratify the Kyoto protocols was life threatening to all of humanity. The core issue had nothing to do with CO2 emissions. The core issue had to do with the march to market of new energy related technological innovations which would drive the world economy. Failure to ratify the Kyoto protocols was an attempt to block the forces of Nature so as to protect the interests of those whose financial interests were dependent on the previous (oil and coal) related energy paradigms.
Armed with this understanding, the behaviour of the World's Central Bankers is exposed for what it is: foolishness and arrogance. The Central Bankers genuinely (but mistakenly) believe that, by managing the money supply, they can flatten the amplitude of a repetitive cycle of a biological phenomenon of Nature. The economy pulsates with a strong heartbeat of its own. It has no need of pacemakers or defibrillators.
From another perspective, the Central Bankers and Politicians should understand this: There will be consequences if you attempt to ‘manage' the biological forces of Nature. The consequences of interfering with the economy's Natural process of inhaling and exhaling will be death by barotrauma. If the lungs are not allowed to exhale, the patient will die because his lungs will eventually burst from all the monetary oxygen you are pumping into them.
Validation
With the melodrama behind us, let's see if we can prove the point by reference to hard financial facts. We need to communicate with the politicians and bankers by means of a hard-nosed language that they can understand – the language of money.
Step 1 will be to quantify the size of the World Economy. At the time that I drafted the following table – the most recent numbers available were based on 2002 GDPs expressed in 1995 dollars.
Table 1:
% Contributions of Major Economies to the
World Economy
(US$ Billion)
(2002 GDPs expressed in 1995 $ and exchange rates)
| Ranking by size | ||
| United States | $ 9,234 | 26.2% |
| Japan | $ 5,667 | 16.0% |
| Germany | $ 2,708 | 7.7% |
| France | $ 1,832 | 5.2% |
| United Kingdom | $ 1,361 | 3.9% |
| Italy | $ 1,234 | 3.5% |
| China | $ 1,207 | 3.4% |
| Brazil | $ 812 | 2.3% |
| Canada | $ 753 | 2.1% |
| Spain | $ 739 | 2.1% |
| Korea , South | $ 680 | 1.9% |
| India | $ 534 | 1.5% |
| Netherlands | $ 505 | 1.4% |
| Australia | $ 469 | 1.3% |
| All Other Countries | $ 7,577 | 21.5% |
| Total | $ 35,311 | 100.0% |
Source: http://www.eia.doe.gov/pub/international/iealf/tableb2.xls
Note: Actual GDP of the USA in 2003 was approximately $11 trillion, which implied a total World GDP in 2003 of $42.3 Trillion
(Source: http://www.eia.doe.gov/pub/international/iealf/tableb2.xls )
Given that we are trying to quantify the importance of oil, it was necessary then to quantify the revenue stream that flowed from producing the then 74 million barrels of oil per day at the then prevailing price of US$45 per barrel.
The calculation is derived as follows:
(74,000,000 X $45 X 365) / $42.3 trillion
= $1.215 trillion/$42.3 trillion
= 2.87%
But it doesn't end there. Oil facilitated the development of the Internal Combustion Engine, the Jet aircraft engine, roads, panel beaters, car insurance, etc. So, if we quantify the revenue streams of all the industries which would not have existed if it were not for oil, we arrive at the following:
Table 2:
Summary:
| Driver | % of Word GDP |
| Oil | 2.87% |
| Motor Car | 2.8% |
| Road Building | 0.5% |
| Oil value add | 2.0% |
| Aircraft Manufacture | 0.58% |
| Air travel/freight | 0.74% |
| Subtotal | 9.46% |
| Estimate all other | 1.01% |
| Estimate Total | 10.5% |
Multiplier Effect
For those readers who have never heard of the “Multiplier Effect” the spreadsheet below will be used as a basis for explaining it:
Table 3:
| 1 | 2 | 3 | |
| 10% | 90% | ||
| Cycle | Income | Save | Spend |
| 1 | $ 100.00 | $ 10.00 | $ 90.00 |
| 2 | $ 90.00 | $ 9.00 | $ 81.00 |
| 3 | $ 81.00 | $ 8.10 | $ 72.90 |
| 4 | $ 72.90 | $ 7.29 | $ 65.61 |
| 5 | $ 65.61 | $ 6.56 | $ 59.05 |
| Subtotal | $ 409.51 | $ 40.95 | $ 368.56 |
In simple terms, the way to interpret the table above is as follows:
If you earn $100, and if you save 10% and spend 90%, then your $90 spending becomes income in the hands of the next guy who, in turn, saves 10% and spends 90%, or $81.00. That $81 represents income in the next guys hands and so on.
After five cycles of spending, the total income that has been generated by the continuing circulation of your original $100 has added up to $409.51.
Clearly, for the world economy as a whole, the “savings rate” is extraordinarily important, so I also researched that number at the time, and this is what I came up with:
Table 4:
Calculation of Weighted Average Savings Rate
Calculation of Weighted Average Savings Rate
Country |
% Total |
Savings Rate |
Contribution |
| World's GDP | |||
| USA | 26% | 1.0% | 0.26% |
| Japan | 16% | 6.2% | 0.99% |
| Germany | 8% | 10.0% | 0.77% |
| France | 5% | 4.5% | 0.23% |
| UK | 4% | 2.0% | 0.08% |
| ROW | 41% | 5.0% | 2.05% |
| 100% | 4.39% |
Sources of info:
USA : http://www.whitehouse.gov/fsbr/output.html
Japan : http://www.mac.doc.gov/japan/source/menu/economics/fact.htm
Germany : Estimate
France : http://www.fundsupermart.com/main/shareinvestor/viewNews.jsp?Article=1394
UK : http://www.tutor2u.net/economics/content/topics/consumption/savings_ratio.htm
ROW: Estimate
Now let's look at what happens if we take $10.50 and multiply it using an assumed savings rate of 4.39%:
Table 5:
| 1 | 2 | 3 | |
| 4.39% | 95.61% | ||
| Cycle | Income | Save | Spend |
| 1 | $ 10.50 | $ 0.46 | $ 10.04 |
| 2 | $ 10.04 | $ 0.44 | $ 9.60 |
| 3 | $ 9.60 | $ 0.42 | $ 9.18 |
| 4 | $ 9.18 | $ 0.40 | $ 8.77 |
| 5 | $ 8.77 | $ 0.39 | $ 8.39 |
| 6 | $ 8.39 | $ 0.37 | $ 8.02 |
| 7 | $ 8.02 | $ 0.35 | $ 7.67 |
| 8 | $ 7.67 | $ 0.34 | $ 7.33 |
| 9 | $ 7.33 | $ 0.32 | $ 7.01 |
| 10 | $ 7.01 | $ 0.31 | $ 6.70 |
| 11 | $ 6.70 | $ 0.29 | $ 6.41 |
| 12 | $ 6.41 | $ 0.28 | $ 6.13 |
| $ 99.62 | $ 4.37 | $ 95.25 |
Hmm? If we talk in terms of percentages rather than dollars, the 10.5% of the world's GDP grows to become 99.62% of the world's GDP after twelve cycles assuming a savings rate of 4.39%.
So the ultimate question that raises its head is: How long will it take for one cycle to complete? If, for example, it takes one month for one cycle to complete then oil and related industries “drive” 99.62% of the entire planet's annual income.
Alternatively, if it takes two months for a cycle to complete, then oil and related industries will drive 56.48% of the entire world's GDP (adding up the income column for periods 1-6). However, in this case there will also be a residual impact from the tail end of the previous year's income which will still be working its way through the system.
It follows that “Velocity of Money” is the final determinant of GDP but, unfortunately, to my knowledge there's no accurate way of quantifying the rate at which the cycles complete. Suffice it to say that oil and related industries have a major impact.
Comment :
There are very few economists who would agree with this way of presenting information. Typically, they would argue in terms of Primary, Secondary and Tertiary (Service) Industries. They would argue that mining, farming and fisheries are the original source of income and it's the income of all Primary Industry that would drive the final economy. I would argue that such an approach is purely theoretical. The practical reality is that without artificial energy to augment human endeavour, there would be almost no mining, virtually no broad-acre farming, and very little deep sea fishing. There would be no electricity to power transport or communications; and we would find ourselves back in the same position where Homo Sapiens found himself when he emerged from the last Ice Age into the current Holocene Interglacial Warming Period.
Conclusions:
1. Energy in general and oil in particular “drives” the world economy.
2. Mega economic cycles wax and wane arising from the emergence of entrepreneurially driven technological innovation which, in turn, is umbilically linked to the emergence of new energy paradigms, which seem to pulse with a biological rhythm.
3. The political leaders of the USA and Australia, proceeding from the misguided view that they were protecting their domestic economies; or with the immoral objective of protecting vested interests of the oil and coal lobbies at the expense of the broader communities whose interests they were supposed to be protecting (you choose which explanation you like because it doesn't really matter) blocked the emergence of the next wave of technologies when they failed to ratify the Kyoto protocols. ( Author's note: Perhaps they performed an unwitting service. I would argue that Nuclear Fission is not the way to go, even though Marchetti seems to think it is )
4. Flowing from this failure, the next generation technologies that should have been waiting for investment were stunted in their growth because they had no latent market demand to drive their commercialisation. Nevertheless, the misguided Central Bankers, believing that they had the power to manage the world economy by pumping money into it, caused a tidal wave of money to flood into a world economy whose oil based technologies were tending towards market saturation in the West.
5. Because this tidal wave of money could not be channelled into appropriate investment, it was diverted into creating massive (and unnecessary) manufacturing capacity in the East, and towards excessive consumption in the West. Debt levels rose, and asset price inflation was the natural consequence. The Property markets, commodity markets and the share markets boomed, giving rise to a false sense of well being.
Epilogue (But hopefully not epitaph)
Question: What will happen to world GDP if the oil price rises from $45 a barrel to (say) $70 a barrel?
If oil rises to $70 a barrel, then the 74 million barrels a day would represent:
$70 X 365 X 74,000,000 = $1.89 trillion
If volumes associated with the economic activity of everything else other than oil remain constant – i.e. If the velocity of money does not change, then prices would rise across the board, and that $1.89 trillion would still represent 2.87% of the world's economy.
In dollar terms, the World Economy would grow from $42.3 trillion to become $65.87 trillion. That's inflation of: 55.7%
Do we really think that the size of the whole pie grows by 55.7% in real terms as a result of the rise in the oil price? Are we really that dumb?
More concerning is this:
If GDP remains constant at $42.3 trillion, and an additional $675 billion is diverted to be spent on oil (at wholesale prices), then that $675 billion will no longer be available for expenditure in other markets. The volume underlying GDP will shrink by $675b/$42.3
= 1.6%
The reader is urged to take a second look at “Table 2” above, and at the item marked “Oil value add” = which contributed a further 2% to world GDP.
This number was derived by adding a mark-up from the per barrel price to the per gallon price at the gasoline pump. Industry practice is to pass on the percentage price rise to the consumer, as opposed to dollar price rise. The more likely volume decline (if there were no price inflation in the GDP numbers) would be something over 2.0% as a consequence of slowing velocity of money.
It follows that the 2001-2006 inflation numbers as shown in Table 6 below cannot be trusted.
Logically, what will actually happen if the oil price stabilises at around $70 a barrel will be a mixture of the following:
- Some (significant) price inflation of World GDP
- Some real growth in some areas of newly emerging industries
- A slowing down in the velocity of money, and a contraction of volumes in some industries – for example, the US motor car industry, new property development, other.
The real GDP (adjusting for price inflation of the oil price) will stay at roughly $42.3 Trillion, or it may rise a couple of percentage points as a result of growth in India and China (which, in 2002 contributed a combined 5% to world GDP). If the politicians tell you anything else then fire them! They are either lying to you, or they don't understand the macro issues. Even China is experiencing capacity problems at this time, and is having to pay higher wages to attract labour; and higher raw material input prices for commodities.
There is no question that inflation is rearing its head. That's why the Dow Jones Industrial Index broke to a new high recently.
In my view, the world is probably experiencing something it has never experienced before. “Stagflation” is when the economy stagnates and we experience inflation. What do you call it when we experience inflation and a simultaneous contraction of output volume?
About two months ago I watched a TV interview of an Australian pensioner who could only have been an accountant when he was gainfully employed. Every week, since the beginning of 2001, he had religiously filed and recorded all his grocery purchases. Because he is a pensioner on a fixed income, his purchasing habits have not changed – so his personal experience is an accurate reflection of the effect of price inflation on his supermarket spending (food, cleaning materials).
The bottom line is that he has personally been experiencing a 12% (twelve percent per annum) compound growth rate in price inflation. I believe him because I can “feel” that has been happening to me. You can too.
In a cynical tribute to our political and banking leaders, I took the trouble to research the Money Supply (M2) numbers and the (Official) CPI numbers in the USA over the following periods:
- 1913 – 1959 (The Fed was established in 1913, and the technique of measuring M2 changed in 1959)
- 1959 – 1970 (1970 was the last ‘honest' year. In 1971, Tricky Dick Nixon closed the Gold Window, and the rot started to set in).
- 1971 – 1981 (1981 was the year before the Reagan Administration took a conscious policy decision to become a deficit sovereign nation, and thereby use the US consumer to “drive” the world economy
- 1982 – 2000 (2000 had the Y2K problem, and it was in that year that the politicians and Central Bankers decided to throw all caution to the winds. They started cooking the CPI statistics around that time)
- 2001 – 2006 (Note: M3 numbers were no longer available from February 2006 for reasons that only “Sir” Alan Greenspan can explain).
Table 6:
| Dates | % Compound Growth in M3 Money Supply | % Compound Growth in M2 Money Supply | % Compound Growth in CPI |
| 1913 - 1959 | n/a | 5.83% p.a. | 2.41% p.a. |
| 1959 -1970 | 8.05% p.a. | 6.99% p.a. | 2.64% p.a. |
| 1971 - 1981 | 12.64% p.a. | 9.47% p.a. | 8.42% p.a. |
| 1982 - 2000 | 6.54% p.a. | 5.91% p.a. | 3.27% p.a. |
| 2001 - 2006 | 8.83% p.a. | 7.28% p.a. | 2.88% p.a. |
Source: CPI 1959 -2000: http://home.att.net/~rdavis2/cpi_m2.html
Source: M2 1959 – 1980 http://home.att.net/~rdavis2/cpi_m2.html
The numbers in the 1959-1970 row and those in the 2001-2006 row are fairly close; but the main differences between those two periods are that:
§ we now have a $60 trillion risk exposure to derivatives which industry was in its infancy then
§ the US Public (Government) debt is around $9 trillion which did not exist then
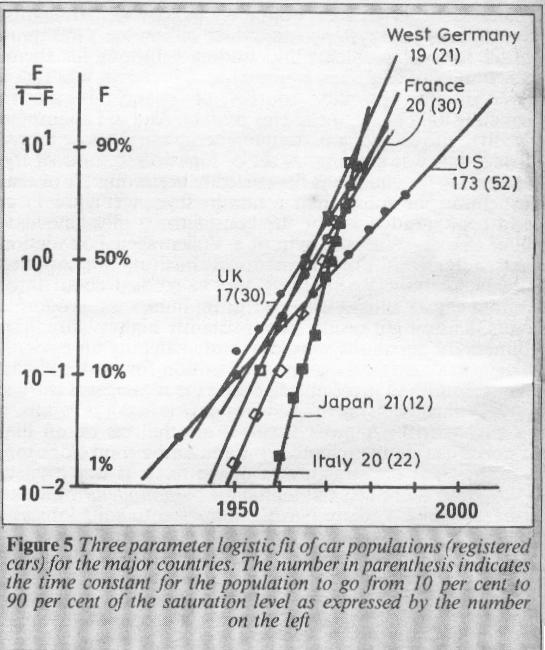
§ “market saturation” had not yet manifested in the USA in the earlier period.
Here is a chart of market penetration of the motor car market as shown by Cesare Marchetti as it was in 1985. Note how the market for motor cars in most Western countries other than the USA seemed to be approaching saturation just at the time that the Volterra Lotka model was forecasting peak oil to arrive.
Overall Conclusion
The rise in the oil price is being accommodated (or driven; you choose) by loose monetary policies of the Worlds Central Bankers and is having a massive impact on world-wide inflation. The stock markets are rising because of this inflation – reflecting an increase in underlying dollar profits which cannot possibly be being matched by volume growth. More likely, volume contraction is being masked by accelerating price inflation. The fact that the politicians are trying to tell us that everything is just fine is a sign-off that the current political system has passed its “use by” date. If we don't kick these clowns and court jesters out of office, and soon, we may find ourselves with a ruptured and irreparable world economy.
Against this background, I have been receiving (thankfully limited) “hate mail” from some people who are questioning everything from my sanity to my loyalty to my integrity because I am asking questions about the linkage between CO2 emissions and Global Warming. Well, I'll say one thing: The Global Warming drama is certainly serving to take our minds off the impact that developments in the oil industry are having on the Global Economy. I am not a conspiracy freak. What I believe we are witnessing is a natural, fear induced manifestation of rationalisation and denial. There is a sort of emotional hysteria washing across the face of the planet.
Fortunately, there are solutions to our problems! Above all, what will be needed is courage and clarity of purpose. In regard to the latter, we need to avoid running in panic into the arms of the wrong energy technology. We need to keep our heads. Perhaps it will help to read the following poem written by Rudyard Kipling:
http://www.swarthmore.edu/~apreset1/docs/if.html
The next article in this series will explain the difference between real market needs and perceived market needs, and why it is critically important to understand the difference.
By Brian Bloom
www.beyondneanderthal.com
Since 1987, when Brian Bloom became involved in the Venture Capital Industry, he has been constantly on the lookout for alternative energy technologies to replace fossil fuels. He has recently completed the manuscript of a novel entitled Beyond Neanderthal which he is targeting to publish within six to nine months.
The novel has been drafted on three levels: As a vehicle for communication it tells the light hearted, romantic story of four heroes in search of alternative energy technologies which can fully replace Neanderthal Fire. On that level, its storyline and language have been crafted to be understood and enjoyed by everyone with a high school education. The second level of the novel explores the intricacies of the processes involved and stimulates thinking about their development. None of the three new energy technologies which it introduces is yet on commercial radar. Gold, the element , (Au) will power one of them. On the third level, it examines why these technologies have not yet been commercialised. The answer: We've got our priorities wrong.
Beyond Neanderthal also provides a roughly quantified strategic plan to commercialise at least two of these technologies within a decade – across the planet. In context of our incorrect priorities, this cannot be achieved by Private Enterprise. Tragically, Governments will not act unless there is pressure from voters. It is therefore necessary to generate a juggernaut tidal wave of that pressure. The cost will be ‘peppercorn' relative to what is being currently considered by some Governments. Together, these three technologies have the power to lift humanity to a new level of evolution. Within a decade, Carbon emissions will plummet but, as you will discover, they are an irrelevancy. Please register your interest to acquire a copy of this novel at www.beyondneanderthal.com . Please also inform all your friends and associates. The more people who read the novel, the greater will be the pressure for Governments to act.
Brian Bloom Archive |
© 2005-2022 http://www.MarketOracle.co.uk - The Market Oracle is a FREE Daily Financial Markets Analysis & Forecasting online publication.