


Stock Market Uptrend Remains Intact According to Leading Economic Indicators
Stock-Markets / Stock Markets 2010 Jan 10, 2010 - 12:49 PM GMTBy: Peter_Navarro

 What’s the first quarter of 2010 going to look like for the economy and stock market? How can you trade some of the macro trends? In this week’s newsletter, I going to answer these questions using my “Always a Winner” forecasting model.
This model is described in my book of the same title, and it uses 11 leading economic indicators and reports to forecast economic growth as measured by the gross domestic product and its four major components -- consumption, investment, net exports, and government spending.
My underlying premise is that the stock market is a leading indicator of the economy. So if sophisticated investors and traders follow the economy closely, they will be better able to determine the stock market trend and profit accordingly.
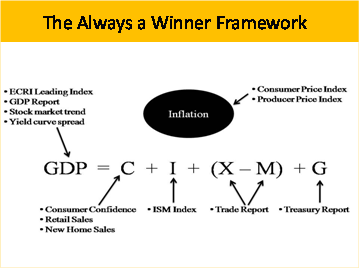
Let's look first at the left-hand side of the GDP equation and three of the most important leading indicators. Let's start with the ECRI Weekly Leading Index.
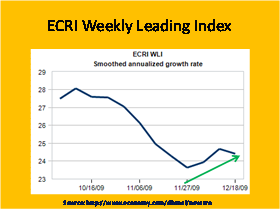
According to the Dismal Scientist website, "Although gains in this index have slowed in recent months, its general trajectory is consistent with continued recovery through at least much of 2010.”
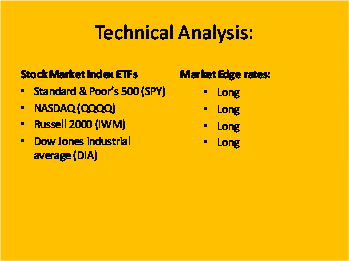
Our next figure is a one-year chart of the four major US stock market indices -- the S&P 500 as represented by the exchange traded fund SPY, the NASDAQ as represented by QQQQ, the Russell 2000 as represented by IWM, and the Dow Jones industrial average as represented by DIA.
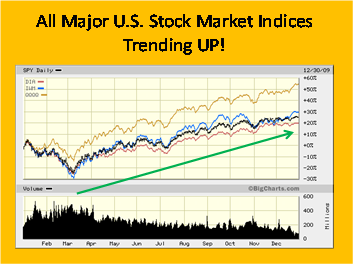
You can see from the chart that all four major indices are trending upward. In addition, a technical analysis by the Market Edge web site rates each of the four major indices a "buy."
With the stock market a leading indicator of the economy, these upward trends and buy signals together forecast continued economic expansion.
Finally, as a third leading indicator of economic growth, there is the bond market yield curve. This chart from Bloomberg.com illustrates the current steep yield curve, which is a bullish economic sign.
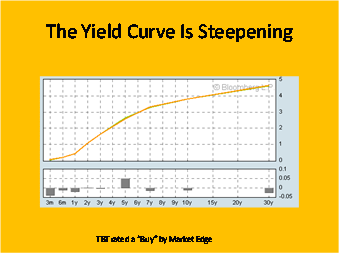
In particular, when bond investors anticipate economic growth and rising inflation, they bid up yields on the long bond and long bond prices fall. To short the long bond, you can buy the exchange traded fund TBT. Right now, the technical analysis web site Market Edge rates TBT a buy – another bullish economic sign.
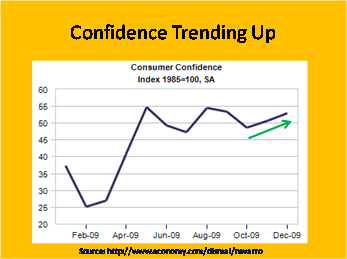
Let's turn now to the right side of the GDP equation and start with the leading economic indicators the always a winner framework uses to track consumption. This figure illustrates that consumer confidence has been trending up since October. However, consumer confidence has been basically flat over the last six months, and remains low by historical norms. Thus, the consumer remains the most important question mark in the economic recovery.
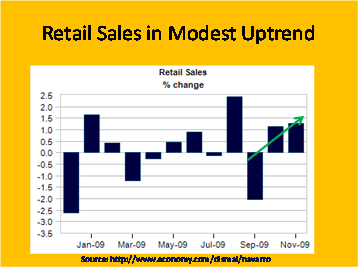
This claim is reinforced in this figure of retail sales. The figure shows a very recent uptrend. However, as reported by the dismal scientist website, "much of retail spending still seems to be driven by discounting…and consumers still have very limited access to cash."
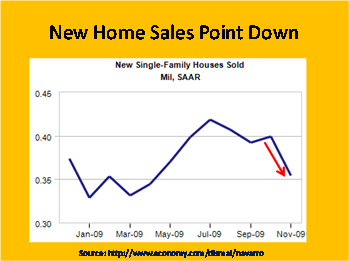
Our final consumption indicator is new home sales. This chart shows a surprisingly large drop in home sales in the last reporting period. If the housing market once again collapses and housing prices begin to fall again, this would be a blow to the economic recovery. This is clearly an indicator to watch.
The cautious optimism surrounding consumption in the GDP equation is reflected in the technical market conditions for two consumer-oriented exchange traded funds. RTH provides an investment vehicle for the retail sector while XHB is an instrument for the homebuilders. Market edge rates both ETFs a "buy", but the conditions for RTH are weakening while XHB is in an only weak upward trend. So be cautious here.
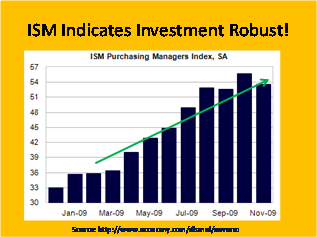
Turning to investment in the GDP equation, this chart of the ISM manufacturing index provides strong evidence that the investment led recovery of 2009 remains resilient. While the index took a small step back in the last reporting period, it remains well over the magic number of 50 -- indicating that the manufacturing sector is expanding at a healthy clip.
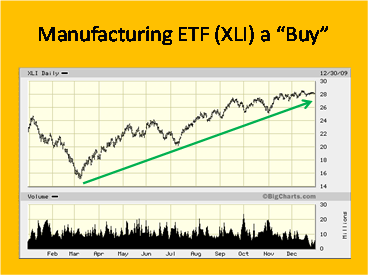
The robustness of the manufacturing sector is reflected in a technical analysis of the industrial sector spider XLI. Market Edge rates XLI a buy while this exchange traded fund is trading near its 52-week high.
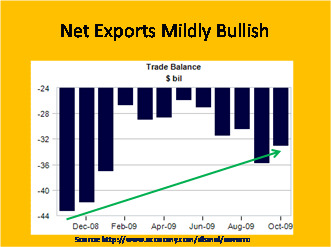
Let's turn now to net exports in the GDP equation. This chart illustrates a slight narrowing of the trade deficit in the last reporting period. Looking behind the numbers, the Dismal Scientist website reports a bullish pattern emerging in both rising exports and trade volumes.
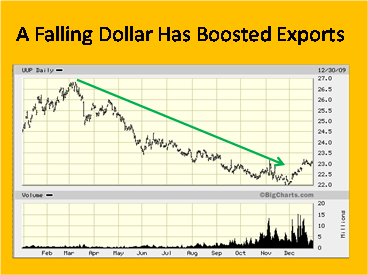
A big part of the improving export picture has been a declining dollar -- as illustrated in this chart of the exchange traded fund for the dollar UUP. As the dollar declined by almost 20% between March and December of 2009, both auto and consumer good exports rose sharply.
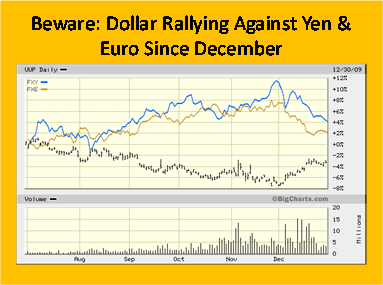
This next chart, however, provides a cautionary note to the improving export picture. It compares the dollar to the exchange traded fund for the Japanese yen, FXY, and an ETF for the euro, FXE. You can see a very clear rebound in the dollar since December that should slow down at least some of the US export growth.
Let's turn now to government spending in the GDP equation. This chart illustrates that the growing US budget deficit remains a problem. As the Dismal Scientist website reports, while the budget deficit has declined from last year's record $1.4 trillion shortfall, it nonetheless will remain above a trillion dollars in the current fiscal year, or about 8% of GDP. This is the second-largest deficit as a share of the economy since World War II, after last year's deficit of 10% of GDP.
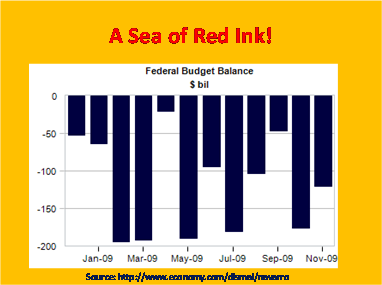
Thus, while America’s deficit spending is expansionary and bullish in the short run, over time, it will inevitably create both inflation problems associated with financing the deficit and the fiscal drag associated with paying the interest on the debt burden. Prudent stock traders will therefore watch this element of the GDP equation closely.
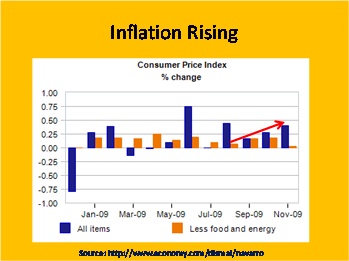
As a final element of the always a winner forecasting model, it is useful to look at inflation indicators like the consumer price index and the producer price index. We look at these indices because if the Federal Reserve sees that inflation is rising above its target level, it will raise interest rates and thereby slow down or choke off any economic expansion and bull market in stocks.
This chart of the Consumer Price Index illustrates a weak upward trend. However, according to the Dismal Scientist website, core inflation, excluding food and energy prices, remains under control. This is bullish news because it means that the Fed probably won't raise interest rates any time soon
The bottom line of our Always a Winner forecast is that virtually all economic indicators reports tracked by the framework are moderately to strongly bullish. At least for the foreseeable future, the economy should continue to expand and the stock market trend should remain up. That said, keep an eye particularly on the major stock market indices for any sign of a bearish reversal. Any such reversal could be the first hint of a faltering economic recovery.
If you want to learn more about how to become your own economic forecaster using the Always a Winner framework, please visit the Dismal Scientist website.
Professor Navarro’s articles have appeared in a wide range of publications, from Business Week, the Los Angeles Times, New York Times and Wall Street Journal to the Harvard Business Review, the MIT Sloan Management Review, and the Journal of Business. His free weekly newsletter is published at www.PeterNavarro.com.
© 2010 Copyright Peter Navarro - All Rights Reserved
Disclaimer: The above is a matter of opinion provided for general information purposes only and is not intended as investment advice. Information and analysis above are derived from sources and utilising methods believed to be reliable, but we cannot accept responsibility for any losses you may incur as a result of this analysis. Individuals should consult with their personal financial advisors.
© 2005-2022 http://www.MarketOracle.co.uk - The Market Oracle is a FREE Daily Financial Markets Analysis & Forecasting online publication.