


Why Most Investors and Traders Fail, Market Barometers Update
Stock-Markets / Financial Markets 2010 Jan 11, 2010 - 12:22 AM GMTBy: Jay_DeVincentis

 Welcome to the biweekly stock barometer. This article comes out every 2 weeks and gives our big picture view of the market. If you're interested in following our signals and learning more about our system, then I invite you to click here and subscribe to the daily service - since the market can turn on a dime and so too can our interpretation as the market gives its daily clues to the future. Also sign up for our free weekly newsletter, where we provide Alerts from our various traders.
We also offer a daily blog and you can follow our blog posts on on Twitter and on Facebook. We also offer a free weekly indicator chart if you visit our home page and scroll to the bottom. This chart will be updated each week, so be sure to check back frequently for updates. www.stockbarometer.com - don't forget to scroll to the bottom.
First of all, I would like to welcome new readers to the format of this article. While its issue number 190 and it comes out every 2 weeks (yes, I've been writing that long), it's something I got away from over the past year. Why? Well, to be honest, when you've been writing as long as I have, you sometimes run out of things to say. (yes, I know that's hard to believe). I've written on almost every topic from almost every angle over the past decade, so it just became a game of repeating content that I've written about in the past. But I came to realize that this article/knowledge is very important to continue sharing. I also believe the timing tools in here are very important to understanding the basis of my system or more importantly, what I'm about, so we'll start including it again.
Second, I want to update you all on some technology changes for 2010. I moved to an iPhone over the course of last year and absolutely love it. No, I'm not going to give you all iPhones, I'm not Oprah J But we are implementing a daily blog on our site. You can also follow the blog posts on Twitter and Facebook. I've included links throughout this article - so feel free to sign up if you really want to hear some of my daily ranting beyond what you already get from me.
Third, I want to thank you for being a subscriber. My goal in doing this has always been 1) to help the individual investor and trader understand that they can read the market, 2) give them the tools to do so and 3) help them profit and 4) and most importantly, help them avoid making the mistakes that I've seen so many (and sometimes myself) make - and save them money in the process, which brings us to this week's topic:
Why most investors and Traders Fail and how avoiding the pitfalls will put you way ahead of the game.
We can approach this topic from two angles - from the newbie investor that's starting to jump into trading or the inexperienced trader who's still early in their learning curve.
From the newbie's point of view, this person simply doesn't know what they don't know, so they're more likely to make a big mistake. They know nothing about market timing, they know nothing about understanding how their emotions will work against them. And they usually jump in with too much or too little money. Too much money and they trade scared (and scared money never makes a good decision). Too little money and the commissions will eat up any chance for them to be profitable.
Not understanding market timing is why most people buy at the top and sell at the bottom. It's really what my service is about. Most people buy at the top because they don't know how to read when the market is overbought. And they don't have the patience to wait until the market is oversold to buy.
Then they trade with too much money - which you'll soon figure out will give you sleeping problems. It'll have you checking your position every 5 minutes at your office (not very productive). And it'll make you trade with emotions, versus a solid plan. Emotions should be left at the door when you trade.
Trade with too little money and the commissions alone will not only eat into your profits, but you'll have to overcome the friction cost. I.e. it's hard enough to trade, but when you have to overcome a 5% loss because your trading with too little money per trade, then you're likely to fail.
From the inexperienced trader's point of view, they know just enough to be dangerous. They don't understand risk and reward, they try to fight the trend, they think they're smarter than the market and they may try to trade too many things at once.
Understanding that losing is as much a part of trading as striking out is a part of playing baseball and you'll be ahead of the game. Then understanding that adhering to a 3:1 money management rule is a key as well - I've seen some traders use a 1:1 rule - meaning they risk the same amount that they try to profit. This is a recipe for disaster. You will soon run out of money.
These are just a few of the literally endless reasons why most traders and investors fail. It's important to be analytical and look at what you're doing and make sure you're not fooling yourself. Otherwise, you'll soon run out of money and that does no one any good.
Use our information to put you ahead of the game - if you're not sure how, feel free to email me or any of our other advisors below - we're here to help you.
Ok, on to this week's charts.
Message From The Markets
Market action is ruled by sentiment and by monitoring market internals and studying sentiment you can reasonably predict future market movements. The basis of the Stock Barometer system is overlaying extremes in sentiment with sound technical analysis to predict the likelihood of future price movement. Each indicator and chart measures the hope, fear and greed of investors and traders from different angles. Follow along with my charts and over time, you'll also learn to understand how to read the markets, which is essential prior to setting up each and every trade.
STOCK BAROMETER CHART
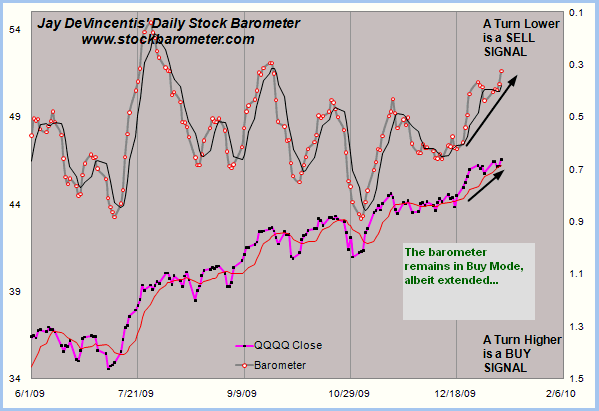
The Stock Barometer is my proprietary market timing system. The direction, slope and level of the Stock Barometer determine our outlook. For example, if the barometer line is moving down, we are in Sell Mode. A Buy or Sell Signal is triggered when the indicator clearly changes direction. Trend and support can override the barometer signals.
EQUITY PUT CALL RATIO CHART
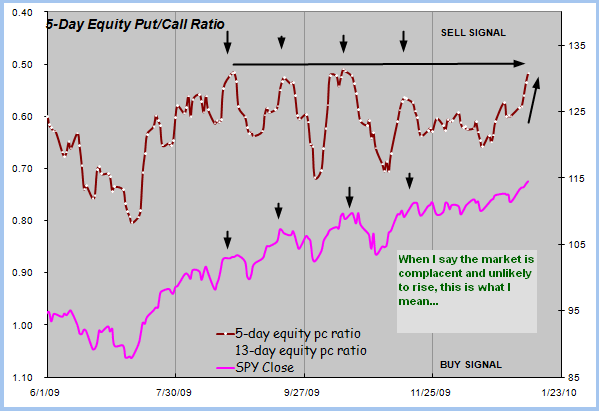
The CBOE put/call ratio is comprised of two sets of data; equity options and index options. The index component contains items that are used as a hedge, thereby distorting the correlation and interpretation of the indicator. We use the equity put/call ratio. This is one of the most accurate read of investor's fear and complacency and thus an accurate contrarian view of the market.
TRIN/ARMS CHART
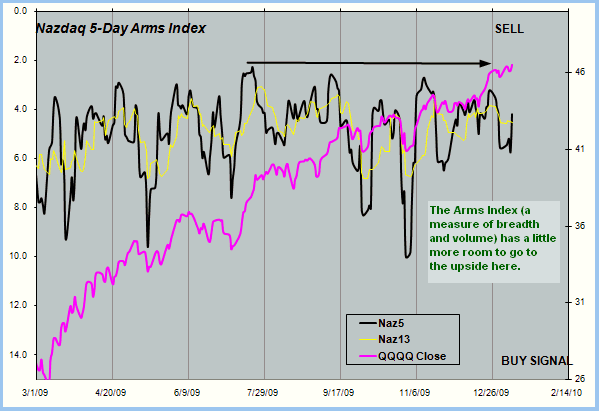
The arms index or also referred to the Trading Index or TRIN for short, is a measure of the ratio of up stocks and down stocks divided by the ratio of up volume and down volume. Our Spread Chart converts the arms index data into momentum Buy and Sell Signals.
TICK CHART
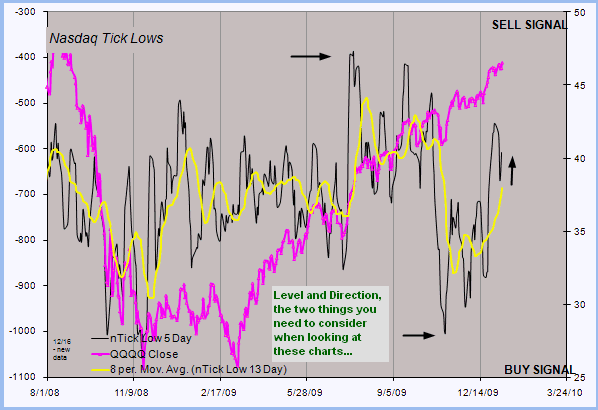
The tick index is represents the sum of all stocks ticking higher minus all stocks ticking lower (a stock is said to be trading on an up tick when it trades at a higher price than the last sale). It's utilized as a day trading tool as it gives you an up to the second read of the intensity of buying and selling.
The J.E.D.I. Trader Stocks, Options and Options on futures advisory service (up over 100% in 2008).
BREADTH (ADVANCE - DECLINE) CHART
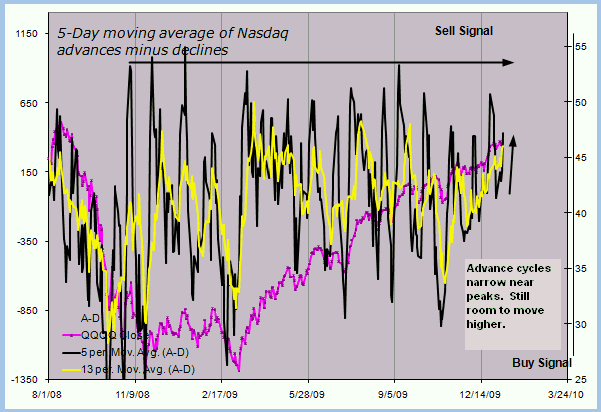
Each day several thousand stocks either advance, decline or remain unchanged. The number of advances and declines normally ranges from +2500 to -2500. A high number of advancing stocks normally marks a top just as a high number of declining stocks normally marks a bottom. Monitoring the 5 and 13-day moving averages of this allows us to better predict future prices.
VXO CHART
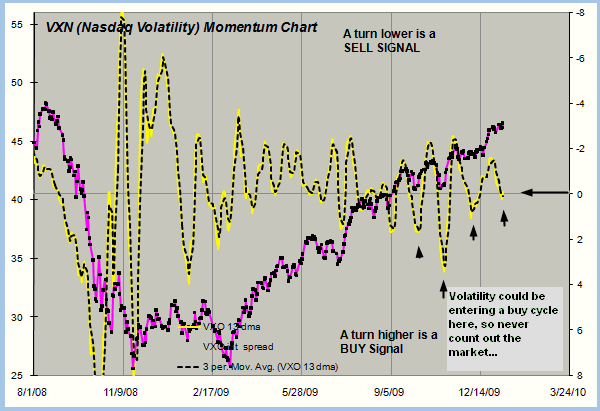
The VIX is a measure of volatility on options pricing. We use the old VIX, which is now called the VXO. The higher the volatility, the more likely the market is close to a bottom, as traders are willing to pay more premium for puts, which act as Insurance on their long positions.
The Advantage Report Market timing advice for only $10.95/month
Potential Cycle Reversal Dates
2010 Potential Reversal Dates: 1/19, 1/28. We publish dates up to 2 months in advance.
We see a move higher into 1/19, then a retracement into 1/28.
My timing work is based on numerous cycles and has resulted in the above potential reversal dates. They're predictive and have nothing to do with the barometer cycle times. Due to their accuracy in the past, I post the dates here.
2009 Published Reversal Dates: 1/20, 2/11, 3/7, 3/15, 4/8, 4/16, 4/27, 5/7, 6/8, 7/2, 7/17, 9/14, 10/10, 10/24, 11/12, 11/30, 12/9, 12/21, 12/29. 2008 Potential Reversal Dates: 12/31, 1/11, 2/1, 2/13, 3/6, 4/5, 4/22, 5/23, 6/6, 6/27, 7/13, 9/2, 10/3, 10/22, 11/10, 12/11. 2007 Potential Reversal Dates: 1/10, 1/14, 1/27, 1/31, 2/3, 2/17, 3/10, 3/24, 4/21, 5/6, 6/15, 8/29, 10/19, 11/29, 12/13, 12/23, 12/31, 1/11/08. 2006 potential reversal dates: 1/16, 1/30, 2/25, 3/19, 4/8, 5/8, 5/19, 6/6(20), 7/24, 8/20, 8/29, 9/15, 10/11, 11/28. 2005 Potential reversal dates: 12/27, 1/25, 2/16, 3/4, 3/14, 3/29, 4/5, 4/19, 5/2, 6/3, 6/10, 7/13, 7/28, 8/12, 8/30-31, 9/22, 10/4, 11/15, 11/20, 12/16.
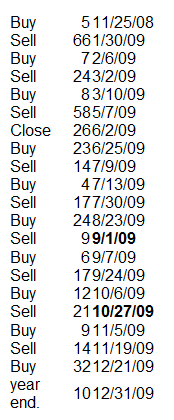
Stock Barometer Buy And Sell Signals
QQQQ or SPY Chart: A chart is provided in every bi-weekly report and shows the barometer Buy and Sell Signals (which are provided in my morning updates) as well as showing the next highlighted 'reversal' window. The numbers adjacent to the buy and sell signals are the number of days between signal (cycle time).
Here are 2009's buy and sell signals for the Stock Barometer.
Money Management & Stops
To trade this system, there are a few things you need to know and address to control your risk:
- This system targets intermediate term moves, of which even in the best years, there are usually only up to 7 profitable intermediate term moves. The rest of the year will be consolidating moves where this system will experience small losses and gains that offset each other.
- This system will usually result in losing trades more than 50% of the time, even in our best years. The key is being positioned properly for longer term moves when they come.
- Therefore it is vitally important that you apply some form of money management to protect your capital.
- Trading a leveraged index fund will result in more risk, since you cannot set stops and you cannot get out intraday.
Accordingly;
- Make sure you set your stops so that you can lose no more than 2% per trade (based on the QQQQ if you're trading leveraged funds and options with our trading service).
Use the following spread/momentum indicators to assist in your trading of the QQQQ, GLD, USD, USO and TLT. They are tuned to deliver signals in line with the Stock Barometer and we use them only in determining our overall outlook for the market and for pinpointing market reversals. The level, direction, and position to the zero line are keys in these indicators. For example, direction determines mode and a buy signal 'above zero' is more bullish than a buy signal 'below zero'.
Gold Spread Indicator (AMEX:GLD)
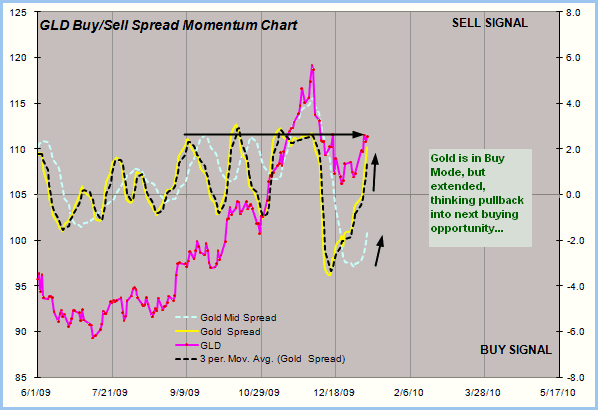
Want to trade Gold? Use our signals with the Gold ETF AMEX:GLD. Gold gives us a general gage to the overall health o f the US Economy and the markets.
US Dollar Index Spread Indicator (INDEX:DXY)
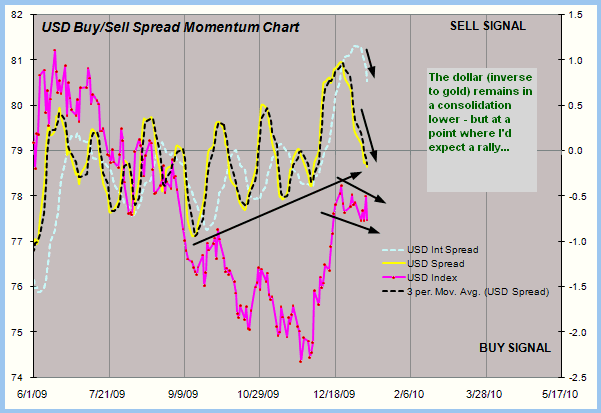
Want to trade the US Dollar? Use our signals with the Power Shares AMEX:UUP: US Dollar Index Bullish Fund and AMEX:UDN: US Dollar Index Bearish Fund.
Bonds Spread Indicator (AMEX:TLT)
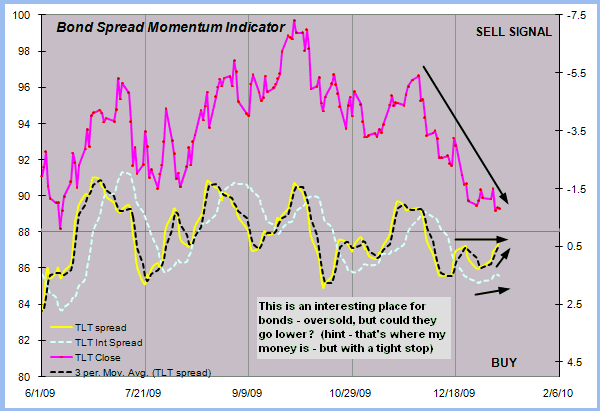
Want to trade Bonds? Use our signals with Lehman's 20 year ETF AMEX:TLT. The direction of bonds has an impact on the stock market. Normally, as bonds go down, stocks will go up and as bonds go up, stocks will go down.
OIL Spread Indicator (AMEX:USO)
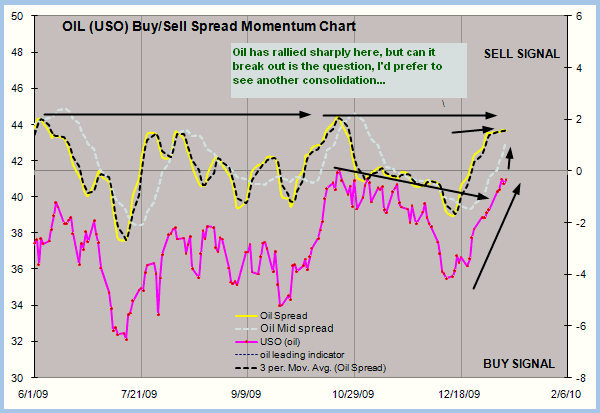
Want to trade OIL? Use our signals with AMEX:USO, the OIL ETF. We look at the price of oil as its level and direction has an impact on the stock market.
Stock Barometer Premier Membership Receive 5 Newsletters, including the Daily Stock Barometer, Stock Options Speculator, QQQQ/Rydex Trader, Market Chat & Explosive Stock Alert FOR ONE LOW PRICE.
Summary & Outlook
We remain in Buy Mode, looking for a move higher into 1/19.
This coming Friday is options expiration. The market has a way to reverse on those dates. Given that and our key reversal date, I'd expect the move higher to continue into Friday or the following week.
Welcome to the biweekly stock barometer. This article comes out every 2 weeks and gives our big picture view of the market. If you're interested in following our signals and learning more about our system, then I invite you to click here and subscribe to the daily service - since the market can turn on a dime and so too can our interpretation as the market gives its daily clues to the future. Also sign up for our free weekly newsletter, where we provide Alerts from our various traders.
We also offer a daily blog and you can follow our blog posts on on Twitter and on Facebook. We also offer a free weekly indicator chart if you visit our home page and scroll to the bottom. This chart will be updated each week, so be sure to check back frequently for updates. www.stockbarometer.com - don't forget to scroll to the bottom.
As always, if you have any questions or comments, feel free to email me here at jay@stockbarometer.com.
Regards,
By Jay DeVincentis
Stock Barometer Premier Membership Receive 5 Newsletters, including the Daily Stock Barometer, Stock Options Speculator, QQQQ/Rydex Trader, Market Chat & Explosive Stock Alert FOR ONE LOW PRICE.
Important Disclosure
Futures, Options, Mutual Fund, ETF and Equity trading have large potential rewards, but also large potential risk. You must be aware of the risks and be willing to accept them in order to invest in these markets. Don't trade with money you can't afford to lose. This is neither a solicitation nor an offer to buy/sell Futures, Options, Mutual Funds or Equities. No representation is being made that any account will or is likely to achieve profits or losses similar to those discussed on this Web site. The past performance of any trading system or methodology is not necessarily indicative of future results.
Performance results are hypothetical. Hypothetical or simulated performance results have certain inherent limitations. Unlike an actual performance record, simulated results do not represent actual trading. Also, since the trades have not actually been executed, the results may have under- or over-compensated for the impact, if any, of certain market factors, such as a lack of liquidity. Simulated trading programs in general are also subject to the fact that they are designed with the benefit of hindsight. No representation is being made that any account will or is likely to achieve profits or losses similar to those shown.
Investment Research Group and all individuals affiliated with Investment Research Group assume no responsibilities for your trading and investment results.
Investment Research Group (IRG), as a publisher of a financial newsletter of general and regular circulation, cannot tender individual investment advice. Only a registered broker or investment adviser may advise you individually on the suitability and performance of your portfolio or specific investments.
In making any investment decision, you will rely solely on your own review and examination of the fact and records relating to such investments. Past performance of our recommendations is not an indication of future performance. The publisher shall have no liability of whatever nature in respect of any claims, damages, loss, or expense arising out of or in connection with the reliance by you on the contents of our Web site, any promotion, published material, alert, or update.
For a complete understanding of the risks associated with trading, see our Risk Disclosure.
© 2010 Copyright Jay DeVincentis - All Rights Reserved
Disclaimer: The above is a matter of opinion provided for general information purposes only and is not intended as investment advice. Information and analysis above are derived from sources and utilising methods believed to be reliable, but we cannot accept responsibility for any losses you may incur as a result of this analysis. Individuals should consult with their personal financial advisors.
© 2005-2022 http://www.MarketOracle.co.uk - The Market Oracle is a FREE Daily Financial Markets Analysis & Forecasting online publication.