


How to use the TICK for an Stock Market Trading Entry Point
InvestorEducation / Learn to Trade Jan 20, 2010 - 03:25 AM GMTBy: Marty_Chenard

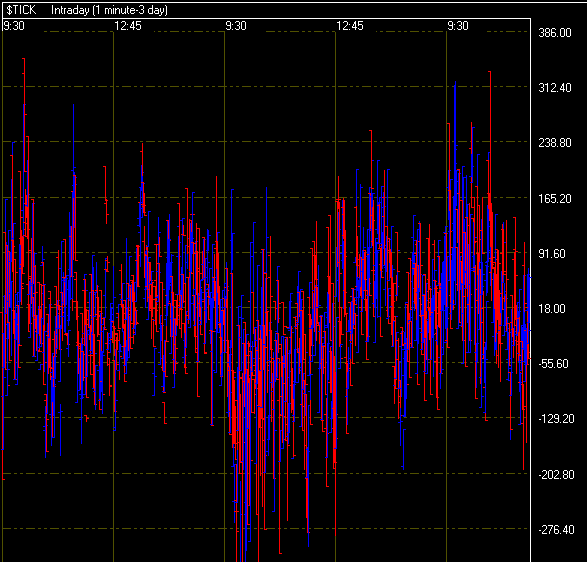
 If you have ever looked at the TICK, it pretty much looks like "noise". With extremely lengthy bars on minute to daily data, it seems like useless data to many. Chart 1 below is an example of TICK data.
While doing research a few years ago, we tested moving averages on the daily ticks as well as many time intervals in minutes.
It was always useless data UNTIL ... we viewed the TICK in "1 minute" intervals and then set a smooth moving average of 80 that magical data appeared.
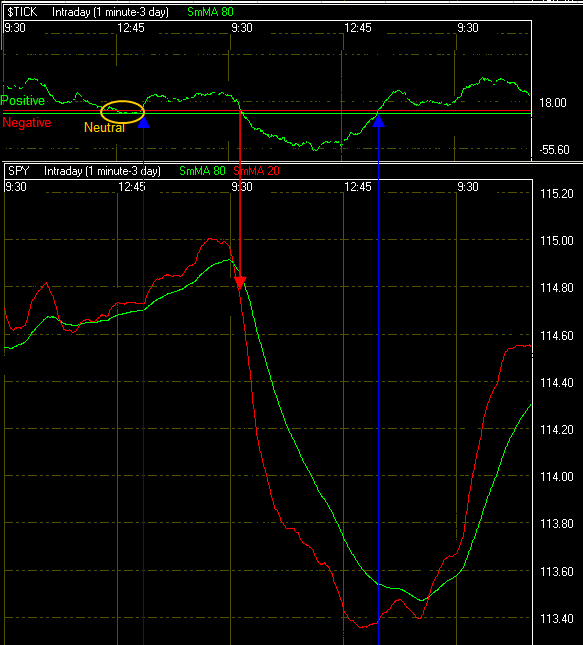
Take a look at the second chart below. It is a 1 minute chart over a 3 day interval. Actually, it is the SAME chart as above, except we show a "smoothed moving average of 80" instead of the ticks. And then, we drew two horizontal lines at the zero level.
Above the horizontal &line is positive, below is negative, and on the line is neutral.
In the chart, we overlaid the action of the SPY so that you can compare the 80 SMA TICK movements to the index.
Note the blue arrows ... when the 80 MVA green TICK line rises above the horizontal lines, it is a trend change signal for the SPY to reverse its trend.
When the 80 MVA green TICK line moves below the horizontal lines, it is a trend change signal to the downside.
As an intra-day trend change indicator, it isn't perfect, so we use additional indicators with it. But, even as shown below, it has a pretty neat correlation relative to the SPY and other indexes.
** Feel free to share this page with others by using the "Send this Page to a Friend" link below.
By Marty Chenard
http://www.stocktiming.com/
Please Note: We do not issue Buy or Sell timing recommendations on these Free daily update pages . I hope you understand, that in fairness, our Buy/Sell recommendations and advanced market Models are only available to our paid subscribers on a password required basis. Membership information
Marty Chenard is the Author and Teacher of two Seminar Courses on "Advanced Technical Analysis Investing", Mr. Chenard has been investing for over 30 years. In 2001 when the NASDAQ dropped 24.5%, his personal investment performance for the year was a gain of 57.428%. He is an Advanced Stock Market Technical Analyst that has developed his own proprietary analytical tools. As a result, he was out of the market two weeks before the 1987 Crash in the most recent Bear Market he faxed his Members in March 2000 telling them all to SELL. He is an advanced technical analyst and not an investment advisor, nor a securities broker.
Marty Chenard Archive |
© 2005-2022 http://www.MarketOracle.co.uk - The Market Oracle is a FREE Daily Financial Markets Analysis & Forecasting online publication.