


Stock Market Outlook and Forecast Into Mid 2010
Stock-Markets / Stock Markets 2010 Jan 25, 2010 - 01:37 AM GMTBy: Donald_W_Dony

 Equity markets have enjoyed a near flawless advance since the March low. Now with the quick retracement last week, many investors are becoming concerned that a steep correction is in the making. It is important to remember that markets typically trade up 1/3rd of the time, down 1/3rd and flat 1/3rd. Models suggest that the probability of a period of horizontal trading is increasing as the bull market moves toward mid-2010.
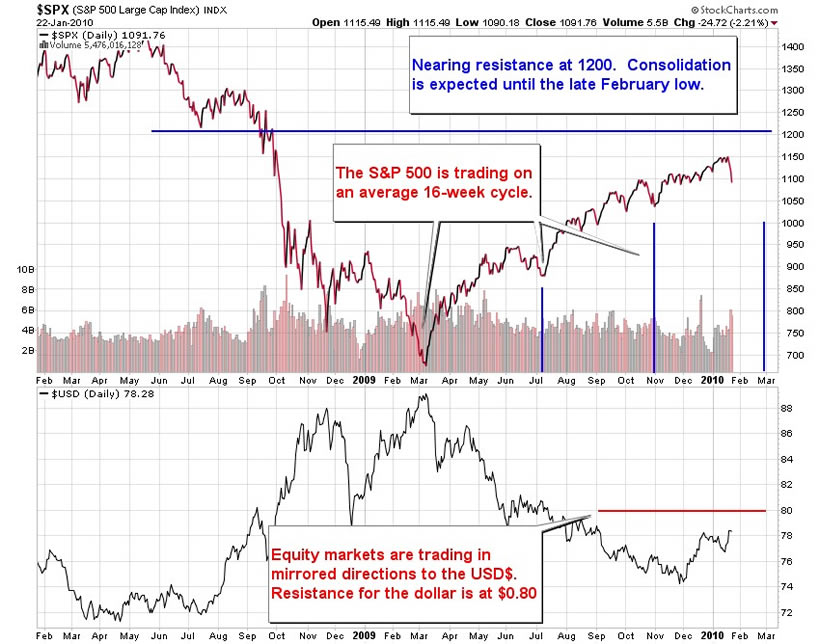
Chart 1 illustrates the relationship between the S&P 500 and the US Dollar Index. The impact of a rising dollar suggests money is shifting short-term out of stocks and into the 'safe haven' USD$. The recent advance of the big dollar has applied increasing downward pressure on the stock index since December.
At what level can the currency be expected to travel to and for how long?
Models for the Greenback imply price resistance can be anticipated at $0.79 to $0.80 and prices should remain positive until February or March. Models also show that the S&P 500 is trading on an average 16-week cycle. This data suggests that the next two key lows coming in the first half of 2010 are in late February to early March and late June to early July.
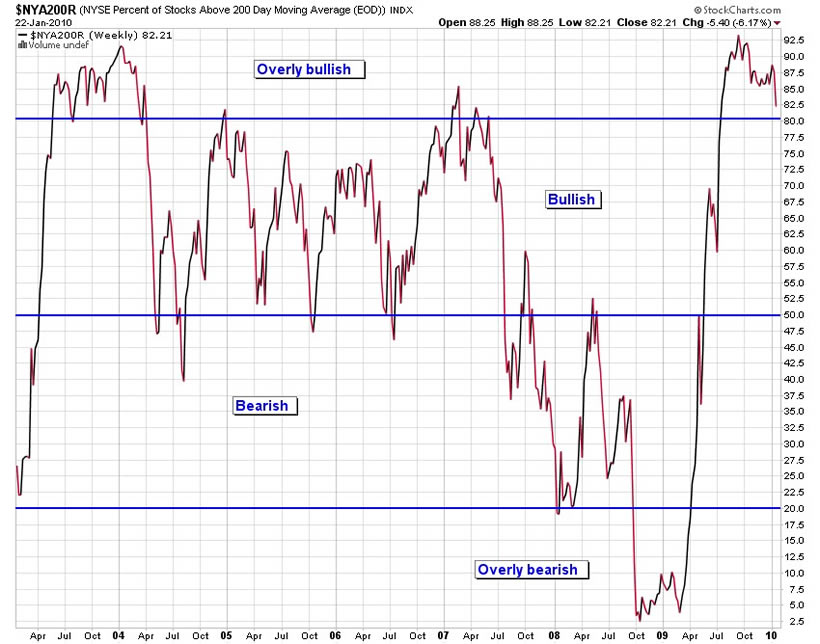
Chart 2 graphs out the percentage of stocks on the NYSE composite that are trading above their long-term 200-day moving average. The current number is 82.21%. This overly bullish reading accompanies many bull markets during their first year. These high levels of participation typically last 6-10 months before they drift lower into the bullish 50% to 80% band. This range provides a more sustainable long-term advance. Models indicate that the percentage of up trending stocks on the 'Big Board' will be below 80% by late Q1. Declines down to the 80% to 50% level are typically associated with 10%-15% equity market dips.
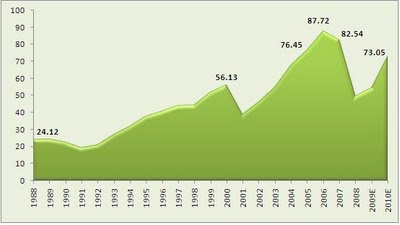 Fundamental calculations place the S&P 500 at about 17% above fair market value. This fact may offer some concern to many investors but the overvaluation is common in early bull markets. Stocks often race ahead of their intrinsic value especially after a pronounced decline. The flow of money from institutional investors at market bottoms typically pushes equities above their true values at the beginning of a new cycle. However, during the second and third year of a bull market, earnings usually catch-up to the prices levels. Company profits increase as the business cycle recovers. Chart 3 illustrates the expected rise in earnings for the S&P 500 in 2010.
Bottom line: The S&P 500 has reached the solid resistance band of 1150 to 1200. Models indicate that the broad-based index should consolidate between support (1000-1025) and resistance (1150-1200) until the early March low and potentially into mid-2010. Consolidations can persist for months. Market action in 2004 and 2005 are good examples. The high bullish percentage of stocks trending upward on the NYSE is anticipated to cool in February and decline into the 50% to 80% band. Probability models (Monte Carlo) suggests that there is a low probability of the S&P 500 trading below 1000 in the first half of 2010. Fundamental considerations stress that company earnings are rising and US unemployment has peaked in Q1. These two underlying elements are expected to help stabilize equity indexes.
More research will be available in the upcoming February newsletter. Go to www.technicalspeculator.com and click on member login for the full report.
Your comments are always welcomed.
By Donald W. Dony, FCSI, MFTA
www.technicalspeculator.com
COPYRIGHT © 2009 Donald W. Dony
Donald W. Dony, FCSI, MFTA has been in the investment profession for over 20 years, first as a stock broker in the mid 1980's and then as the principal of D. W. Dony and Associates Inc., a financial consulting firm to present. He is the editor and publisher of the Technical Speculator, a monthly international investment newsletter, which specializes in major world equity markets, currencies, bonds and interest rates as well as the precious metals markets.
Donald is also an instructor for the Canadian Securities Institute (CSI). He is often called upon to design technical analysis training programs and to provide teaching to industry professionals on technical analysis at many of Canada's leading brokerage firms. He is a respected specialist in the area of intermarket and cycle analysis and a frequent speaker at investment conferences.
Mr. Dony is a member of the Canadian Society of Technical Analysts (CSTA) and the International Federation of Technical Analysts (IFTA).
Donald W. Dony Archive |
© 2005-2022 http://www.MarketOracle.co.uk - The Market Oracle is a FREE Daily Financial Markets Analysis & Forecasting online publication.