


Global Economies Debt Crisis, Japan Heading for Currency Crisis
Economics / Global Debt Crisis Jan 25, 2010 - 09:47 AM GMTBy: Paul_L_Kasriel

 A lot has been written in recent months about the exploding U.S. Treasury debt and how the U.S. dollar will surely suffer as a result of it. And, there is no doubt that the debt has exploded and is projected to continue rising at a relatively rapid rate for as far as the eye can see. The relatively rapid projected increase in U.S. Treasury debt 10 years out is primarily due to the large number of baby-boomers becoming Medicare recipients and the projections of rising Medicare costs per baby-boomer.
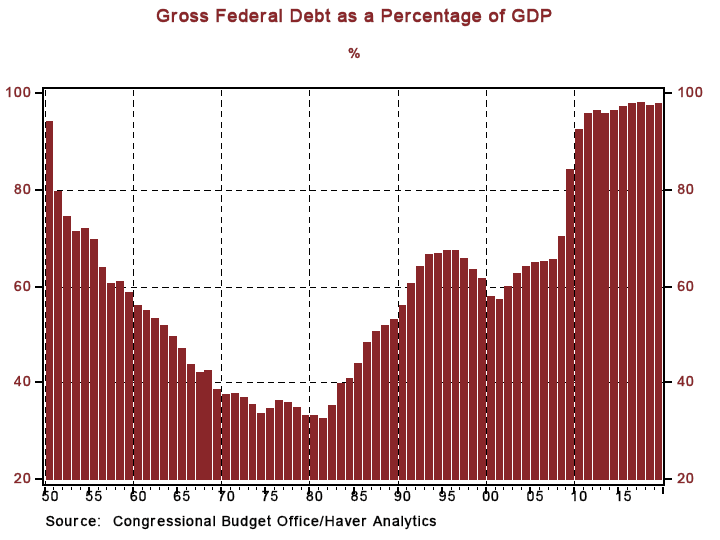
Shown in Chart 1 is fiscal year-end U.S. Treasury debt as a percent of nominal U.S. GDP, including the Congressional Budget Office's (CBO) projections of these percentages for the fiscal years 2009 through 2019. At the end of fiscal year 1950, Treasury debt was 94.1% of GDP, reflecting the debt hangover from WWII. The projection for the end of fiscal 2009 is 84.1%. Over the 10 years ended 2019, the CBO projects that Treasury debt outstanding will average 96.4% -- a record for the post-WWII era. Pretty scary stuff!
Chart 1
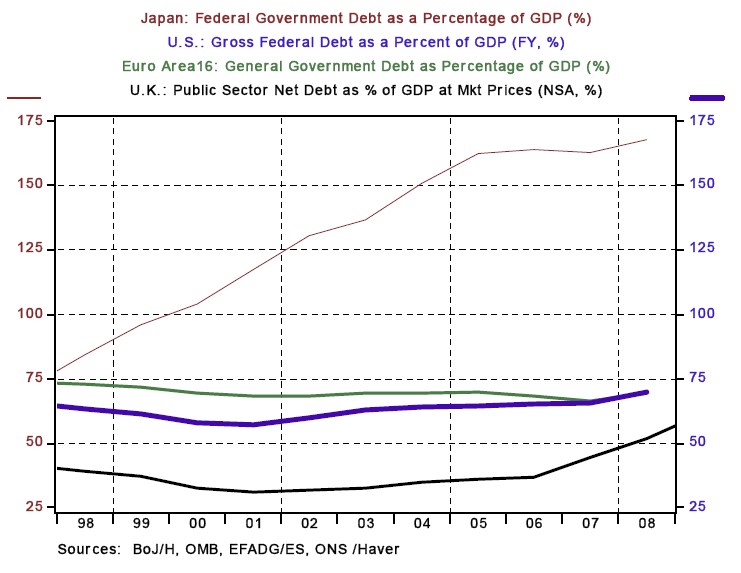
Although I do not have data on projections on government debt-to-GDP ratios for other developed economies, I do have actual historical data, which are shown in Chart 2. In 2008, the latest complete data for all, Japan leads developed economies with regard to government debt-to-GDP ratios, coming in at 167.6%, followed by the U.S. at 70.2%, the euro-zone at 69.3% and, bringing up the rear, the UK at 51.7%. So, Japan, as of 2008, already had a much higher government debt-to-GDP ratio than the U.S. is projected to have in the 10 years ended 2019. Talk about scary stuff!
Chart 2
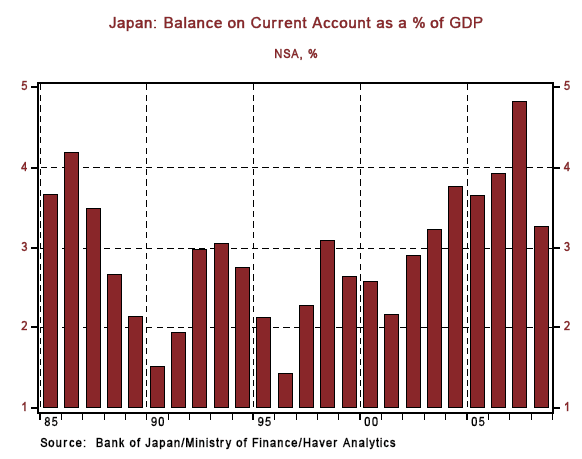
Japan has experienced a high national saving rate, in part because of a high household saving rate (see Chart 3). Japan's high national saving rate is reflected by its current account surpluses in the past 25 years (see Chart 4). In effect, the Japanese have saved so much that they not only have been financing their own government deficits but exporting financial capital to other economies to help finance their government deficits, too.
Chart 3
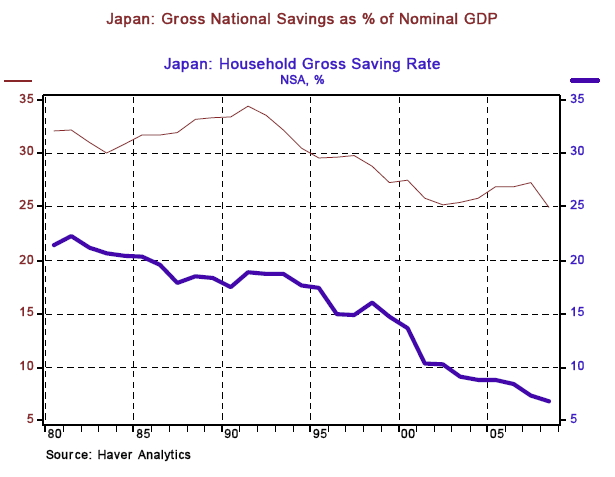
Chart 4
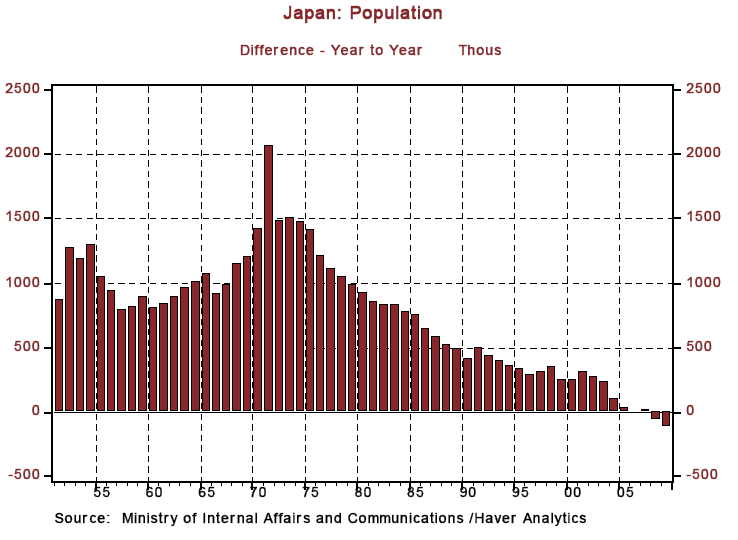
But will Japan be able to keep financing its own government deficits internally? As shown in Chart 5, the Japanese population is declining. One of the reasons the Japanese population is declining is that it is aging rapidly. As more and more Japanese retire, the household saving rate will decline further as Japanese seniors deplete their accumulated financial capital to live on. Although a lot is written in reference to the government debt problems the U.S. is about to incur and how the U.S. dollar will depreciate as a result, very little seems to be written, in the U.S. press, at least, about the looming debt problem faced by Japan.
Chart 5
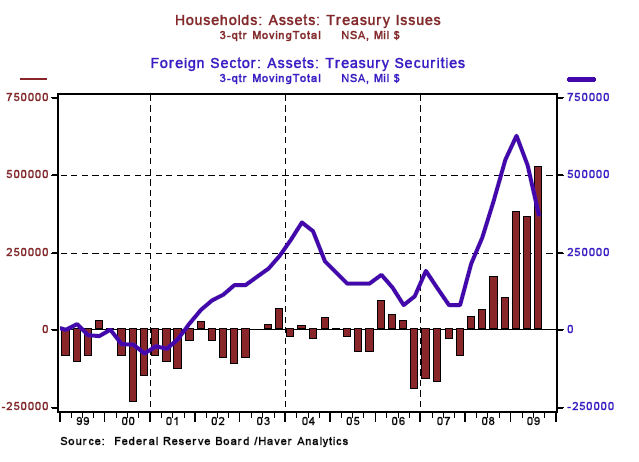
With respect to the U.S., although the federal government has stepped up its rate of dissaving, households have stepped up their rate of saving. From 1999 through 2006, U.S. households were consistently net demanders of funds. That is, their net acquisitions of financial assets were consistently less than their net accumulation of debt (see Chart 6). Starting in 2007, U.S. households once again conformed to the post-war norm by becoming net suppliers of funds. In the first three quarters of 2009, U.S. household purchases of U.S. Treasury debt outstripped foreign purchases of U.S. debt, including foreign official purchases (see Chart 7).
Chart 6
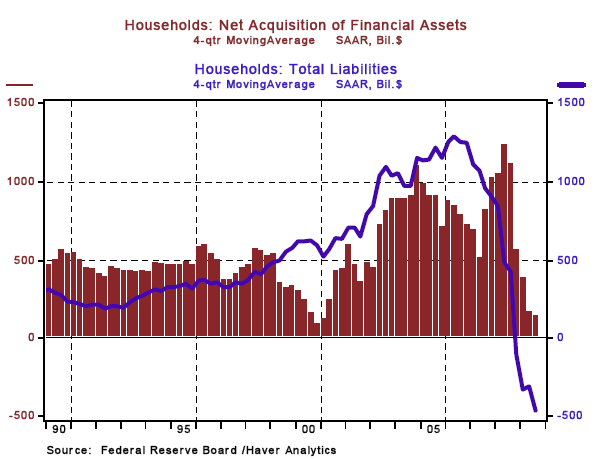
Chart 7
In sum, if you want to worry about government debt problems in the developed economies, I suggest you start with Japan. Its current government debt-to-GDP ratio is considerably higher than what is projected for the U.S. Japan's household saving rate is declining while the that of the U.S. has started to climb again. If you were a middle-aged Chinese or Indian investor, where would you rather place some of your funds? In Japan, with its declining population, entrepreneurial-sapping government regulation and cultural bias against individualism? Or in the U.S., with its still growing population and a culture of entrepreneurship? If there is going to be a government debt-induced currency crisis in the next 10 years in a developed economy, my money is on the yen, not the dollar.
Note: Don't forget to watch "Feed the Fish http://www.feedthefishmovie.com/"
Paul Kasriel is the recipient of the 2006 Lawrence R. Klein Award for Blue Chip Forecasting Accuracy
By Paul L. Kasriel
The Northern Trust Company
Economic Research Department - Daily Global Commentary
Copyright © 2010 Paul Kasriel
Paul joined the economic research unit of The Northern Trust Company in 1986 as Vice President and Economist, being named Senior Vice President and Director of Economic Research in 2000. His economic and interest rate forecasts are used both internally and by clients. The accuracy of the Economic Research Department's forecasts has consistently been highly-ranked in the Blue Chip survey of about 50 forecasters over the years. To that point, Paul received the prestigious 2006 Lawrence R. Klein Award for having the most accurate economic forecast among the Blue Chip survey participants for the years 2002 through 2005.
The opinions expressed herein are those of the author and do not necessarily represent the views of The Northern Trust Company. The Northern Trust Company does not warrant the accuracy or completeness of information contained herein, such information is subject to change and is not intended to influence your investment decisions.
Paul L. Kasriel Archive |
© 2005-2022 http://www.MarketOracle.co.uk - The Market Oracle is a FREE Daily Financial Markets Analysis & Forecasting online publication.