Most Popular
1. It’s a New Macro, the Gold Market Knows It, But Dead Men Walking Do Not (yet)- Gary_Tanashian
2.Stock Market Presidential Election Cycle Seasonal Trend Analysis - Nadeem_Walayat
3. Bitcoin S&P Pattern - Nadeem_Walayat
4.Nvidia Blow Off Top - Flying High like the Phoenix too Close to the Sun - Nadeem_Walayat
4.U.S. financial market’s “Weimar phase” impact to your fiat and digital assets - Raymond_Matison
5. How to Profit from the Global Warming ClImate Change Mega Death Trend - Part1 - Nadeem_Walayat
7.Bitcoin Gravy Train Trend Forecast 2024 - - Nadeem_Walayat
8.The Bond Trade and Interest Rates - Nadeem_Walayat
9.It’s Easy to Scream Stocks Bubble! - Stephen_McBride
10.Fed’s Next Intertest Rate Move might not align with popular consensus - Richard_Mills
Last 7 days
Friday Stock Market CRASH Following Israel Attack on Iranian Nuclear Facilities - 19th Apr 24
All Measures to Combat Global Warming Are Smoke and Mirrors! - 18th Apr 24
Cisco Then vs. Nvidia Now - 18th Apr 24
Is the Biden Administration Trying To Destroy the Dollar? - 18th Apr 24
S&P Stock Market Trend Forecast to Dec 2024 - 16th Apr 24
No Deposit Bonuses: Boost Your Finances - 16th Apr 24
Global Warming ClImate Change Mega Death Trend - 8th Apr 24
Gold Is Rallying Again, But Silver Could Get REALLY Interesting - 8th Apr 24
Media Elite Belittle Inflation Struggles of Ordinary Americans - 8th Apr 24
Profit from the Roaring AI 2020's Tech Stocks Economic Boom - 8th Apr 24
Stock Market Election Year Five Nights at Freddy's - 7th Apr 24
It’s a New Macro, the Gold Market Knows It, But Dead Men Walking Do Not (yet)- 7th Apr 24
AI Revolution and NVDA: Why Tough Going May Be Ahead - 7th Apr 24
Hidden cost of US homeownership just saw its biggest spike in 5 years - 7th Apr 24
What Happens To Gold Price If The Fed Doesn’t Cut Rates? - 7th Apr 24
The Fed is becoming increasingly divided on interest rates - 7th Apr 24
The Evils of Paper Money Have no End - 7th Apr 24
Stock Market Presidential Election Cycle Seasonal Trend Analysis - 3rd Apr 24
Stock Market Presidential Election Cycle Seasonal Trend - 2nd Apr 24
Dow Stock Market Annual Percent Change Analysis 2024 - 2nd Apr 24
Bitcoin S&P Pattern - 31st Mar 24
S&P Stock Market Correlating Seasonal Swings - 31st Mar 24
S&P SEASONAL ANALYSIS - 31st Mar 24
Here's a Dirty Little Secret: Federal Reserve Monetary Policy Is Still Loose - 31st Mar 24
Tandem Chairman Paul Pester on Fintech, AI, and the Future of Banking in the UK - 31st Mar 24
Stock Market Volatility (VIX) - 25th Mar 24
Stock Market Investor Sentiment - 25th Mar 24
The Federal Reserve Didn't Do Anything But It Had Plenty to Say - 25th Mar 24

Market Oracle FREE Newsletter

How to Protect your Wealth by Investing in AI Tech Stocks

Crude Oil Black Gold Trade Zone Strategy

Commodities / Crude Oil Feb 11, 2010 - 08:43 AM GMT

By: Joseph_Russo

Commodities

Visual Guidance | Buy Weakness | Sell Strength >> Crude Oil

One of the highest standards in assessing forecasting models is to determine whether such models provide consistent forward-looking guidance before the fact, not after.


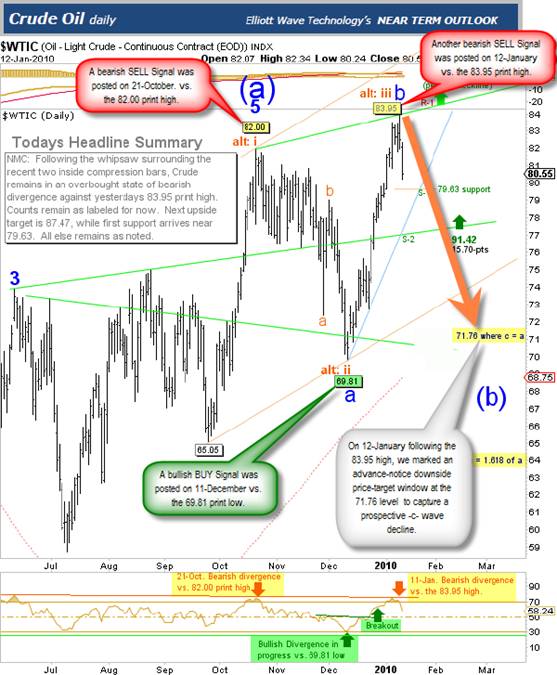
Though we presented the chart below to members on January 12, the highlighted signals began back on October 21, 2009.

We intentionally limit lengthy written arguments, and present guidance in the most effective format to act upon, visually. With that said, we will leave most of the storytelling to the charts.

Every Chart Tells the Story

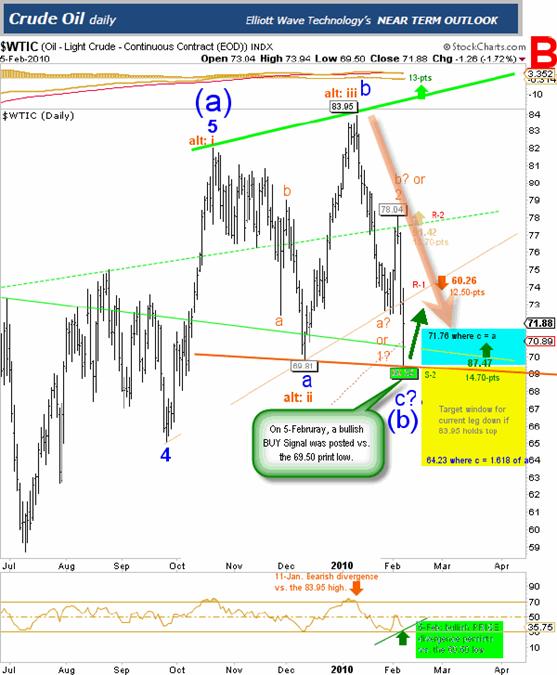
From October 21 - December 11, Crude Oil plunged $12.20 or 14.87%. From December 11 - January 11, Crude rallied back $14.14 or 20.25%. From January 11 - February 5, Crude plunged again, this time by $14.45 giving up its previous advance entirely.

Illustrated, are the results of our strategic forecasting models, which we construct to buy weakness and sell strength. These visual charts delivered membership the forward-looking guidance to capture major portions of each of these significant moves.

Whether accessed through our (NTO) Near Term Outlook, (PTP) Position Traders Perspective, or Platinum service, members following our Crude Oil charts from October of '09 have had four killer opportunities to reap extraordinary profits from the visual forecasting guidance presented in our publications.

Since our most recent bullish buy-signal noted on February 5, Crude has rallied $5.02 or 7.22% to its closing price of $74.52 on February 10.

By Joseph Russo
Chief Publisher and Technical Analyst
Elliott Wave Technology
Email Author

Copyright © 2009 Elliott Wave Technology. All Rights Reserved.
Joseph Russo, presently the Publisher and Chief Market analyst for Elliott Wave Technology, has been studying Elliott Wave Theory, and the Technical Analysis of Financial Markets since 1991 and currently maintains active member status in the "Market Technicians Association." Joe continues to expand his body of knowledge through the MTA's accredited CMT program.

Joseph Russo Archive

© 2005-2022 http://www.MarketOracle.co.uk - The Market Oracle is a FREE Daily Financial Markets Analysis & Forecasting online publication.


Post Comment

Only logged in users are allowed to post comments. Register/ Log in