


Stock Market Investor Sentiment in Bounce Mode
Stock-Markets / Stock Market Sentiment Feb 21, 2010 - 04:24 AM GMTBy: Guy_Lerner

 The investor sentiment data is consistent with a market that is in bounce mode. Following the late January sell off, investors really did not become too bearish. The subsequent bounce over the past 2 weeks has once again created a sense of complacency across our various metrics. In light of this, it will be difficult for the major stock indices to climb to new highs. Despite the recent short term strength, it is still my contention that we will need to go lower before heading meaningfully higher. I discussed the research behind this claim in the article, "Why I Think We Need To Go Lower Before Going Higher".
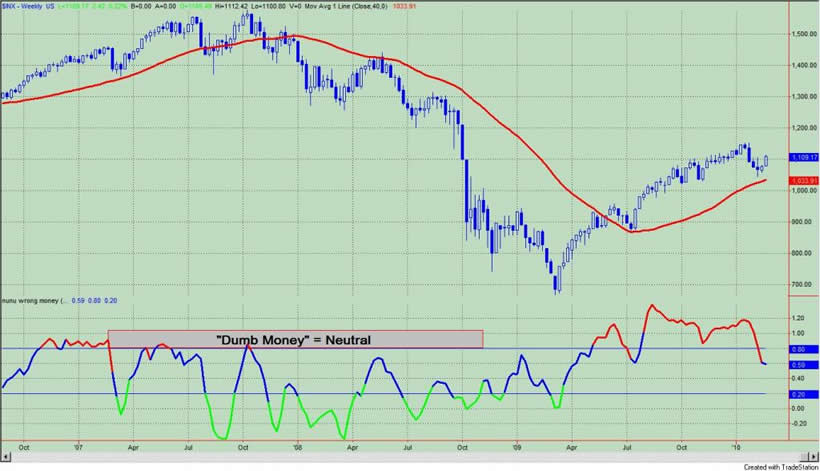
The "Dumb Money" indicator, which is shown in figure 1, looks for extremes in the data from 4 different groups of investors who historically have been wrong on the market: 1) Investor Intelligence; 2) Market Vane; 3) American Association of Individual Investors; and 4) the put call ratio. The "Dumb Money" indicator is neutral.
The "Smart Money" indicator is shown in figure 2. The "smart money" indicator is a composite of the following data: 1) public to specialist short ratio; 2) specialist short to total short ratio; 3) SP100 option traders. The Smart Money indicator is neutral to bearish.
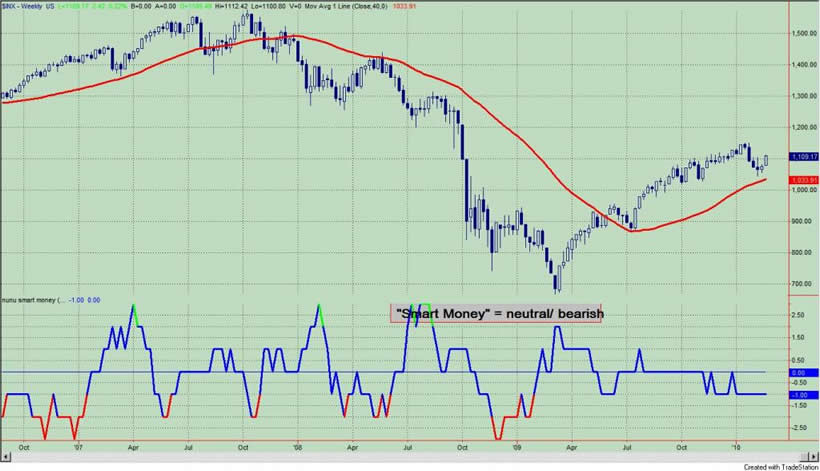
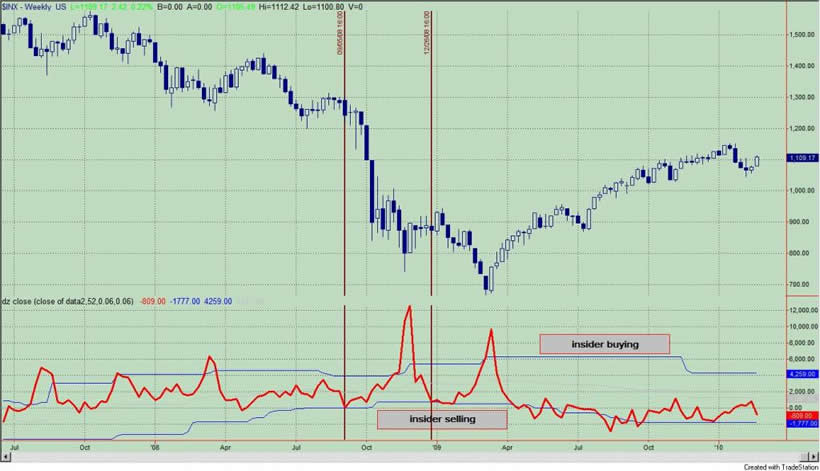
Figure 3 is a weekly chart of the S&P500 with the InsiderScore "entire market" value in the lower panel. Insider trading volumes remain light although selling is picking up as prices on the major indices rise.
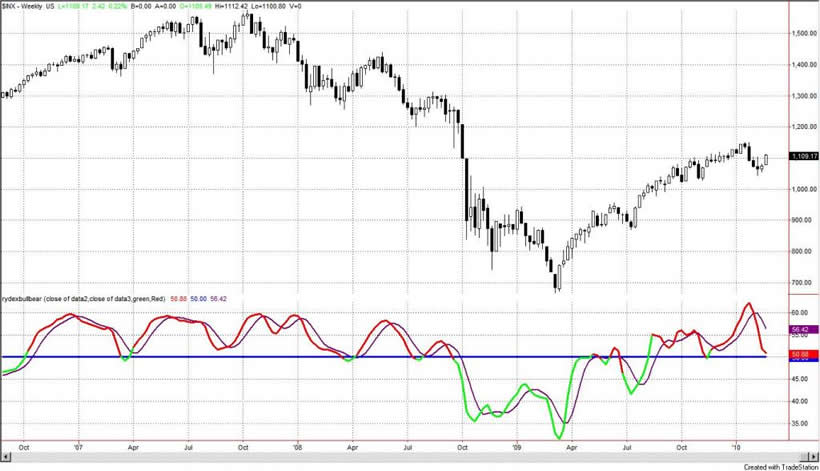
I ask myself one simple question every week: is this the market environment that will take me from here to there? From a sentiment perspective the answer is "no". The "smart money" and insiders have yet to turn bullish, and at best, only some of the shorter term Rydex data would suggest that the bounce may be with us for a few more days. This is not the environment where I will be making the big bet.
By Guy Lerner
http://thetechnicaltakedotcom.blogspot.com/
Guy M. Lerner, MD is the founder of ARL Advisers, LLC and managing partner of ARL Investment Partners, L.P. Dr. Lerner utilizes a research driven approach to determine those factors which lead to sustainable moves in the markets. He has developed many proprietary tools and trading models in his quest to outperform. Over the past four years, Lerner has shared his innovative approach with the readers of RealMoney.com and TheStreet.com as a featured columnist. He has been a regular guest on the Money Man Radio Show, DEX-TV, routinely published in the some of the most widely-read financial publications and has been a marquee speaker at financial seminars around the world.
© 2010 Copyright Guy Lerner - All Rights Reserved
Disclaimer: The above is a matter of opinion provided for general information purposes only and is not intended as investment advice. Information and analysis above are derived from sources and utilising methods believed to be reliable, but we cannot accept responsibility for any losses you may incur as a result of this analysis. Individuals should consult with their personal financial advisors.
Guy Lerner Archive |
© 2005-2022 http://www.MarketOracle.co.uk - The Market Oracle is a FREE Daily Financial Markets Analysis & Forecasting online publication.