


Stock Markets Testing the 78.6 Fibonacci Level
Stock-Markets / Stock Markets 2010 Mar 04, 2010 - 03:32 PM GMTBy: David_Grandey

 What’s Behind Doors 1, 2 and 3?
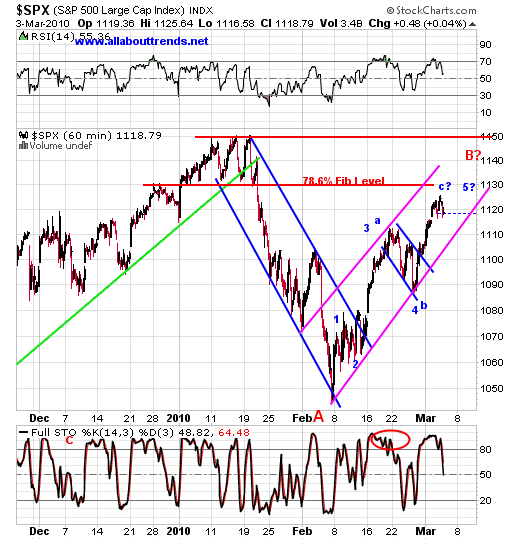
Here we are testing the 78.6 Fibonacci Level.
You've all heard us say that the OTC Comp leads the market. Well we have an even better leader and that is the Russell 2000 index below.
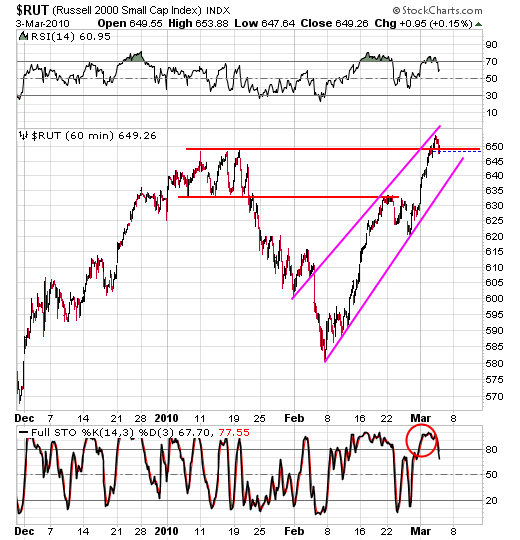
As you can see the Russell 2000 index has already broken into a new high by a smidge. That doesn't mean the SPX and OTC Comp will, but it bears watching. You can also see it's overbought. The next day or so a test down to trend channel support which is clearly defined in pink would not surprise me.
It's all about the Bottom PINK LINE. It's all you need to know. It's still intact and still the order of the day. We will not get any decisive break to the downside or the start of a C wave TILL WE BREAK THIS LINE. This is why it's imperative that we continue to monitor this line.
If we are going to put a lasting top in all of this leads us to a few scenarios to be on the lookout for from here. Try to follow along in the chart below.
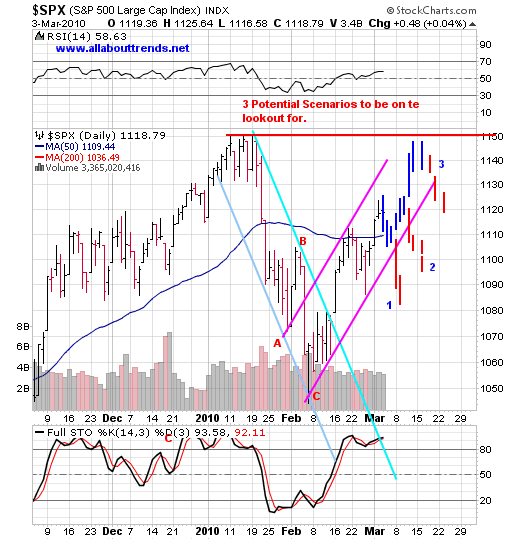
Scenario 1 as labeled: We come down to trend channel support (blue hash marks) and break it (red hash marks), in which case the SPX and OTC Comp ended up staging a 1st lower high and it's a retest of the February lows for starters. Unless Plunge Protection wants to step in.
Scenario 2: We come down to trend channel support, bounce and retest the highs of today for a double top then roll over to the retest of the February lows.
Scenario 3: We come down to trend channel support, bounce and head for a retest of the January highs (1150) for a double top.
Only time will tell so we want to be on our toes for one of these three scenarios. We will keep monitoring these scenarios in our daily updates.
In the meantime below are some charts of each scenario to give you some past examples.
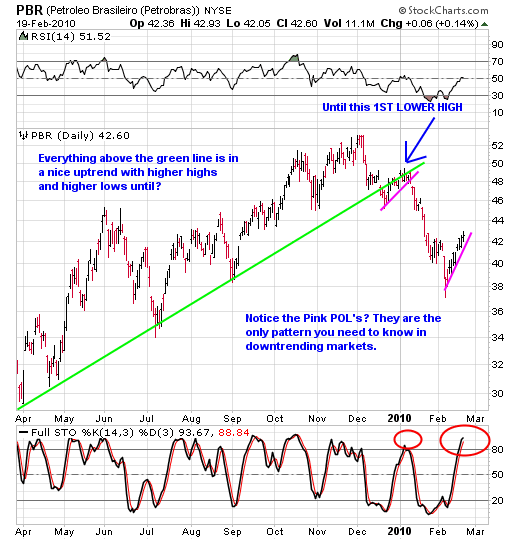
Scenario 1 is just below -- a 1st lower high
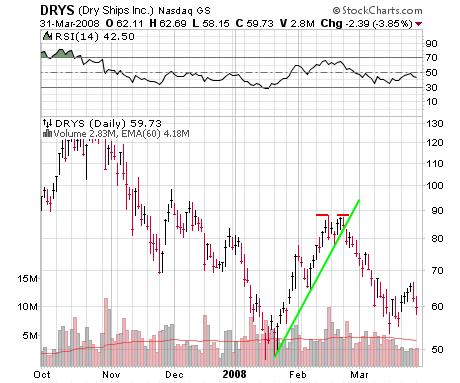
Scenario 2 is that of DRYS below albeit the top channel line isn't drawn but you get the pattern we hope. One could also say it's an Elliot 5-waver with a truncated 5th or what's also commonly called a double top. Then the green trendline break to the downside of course.
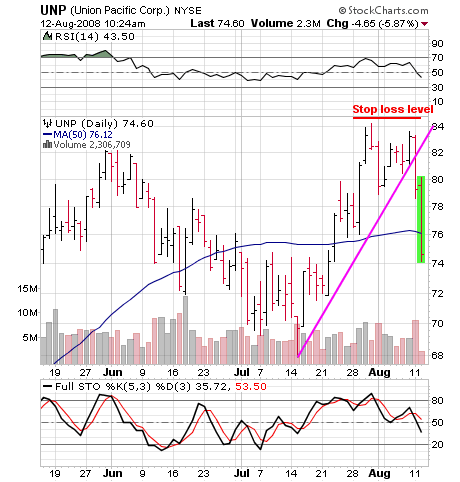
A past example of Scenario 3 is shown below. It's basically a full retest of the highs. Here too it has that double top look before it fell apart.
Now that you know what to watch for or watch out for depending upon who you are and who you choose to be you can use it to your advantage. Should any of these scenarios transpire you won't be one who goes Wha? Huh? What Just happened?! should anyone of them come to fruition.
You'll have a heads up and know what you need to do to protect yourself first and foremost and then 2ndly use it to profit from via short sells and inverse ETF exposure.
By David Grandey
www.allabouttrends.net
To learn more, sign up for our free newsletter and receive our free report -- "How To Outperform 90% Of Wall Street With Just $500 A Week."
David Grandey is the founder of All About Trends, an email newsletter service revealing stocks in ideal set-ups offering potential significant short-term gains. A successful canslim-based stock market investor for the past 10 years, he has worked for Meriwest Credit Union Silicon Valley Bank, helping to establish brand awareness and credibility through feature editorial coverage in leading national and local news media.
© 2010 Copyright David Grandey- All Rights Reserved Disclaimer: The above is a matter of opinion provided for general information purposes only and is not intended as investment advice. Information and analysis above are derived from sources and utilising methods believed to be reliable, but we cannot accept responsibility for any losses you may incur as a result of this analysis. Individuals should consult with their personal financial advisors.
© 2005-2022 http://www.MarketOracle.co.uk - The Market Oracle is a FREE Daily Financial Markets Analysis & Forecasting online publication.