Stock Market Distribution Day Friday?
Stock-Markets / Stock Markets 2010 Mar 20, 2010 - 10:18 AM GMTBy: Piazzi
 Friday had all the makings of a distribution day. It, however, was an OpEx day and we can’t know how much of the activity were market’s way of punishing late buyers and rally hopefuls. Monday, and Tuesday’s action will tell us if this was yet another quick selloff buying opportunity or the beginning of a pullback/correction.
This is a weekly chart of the index
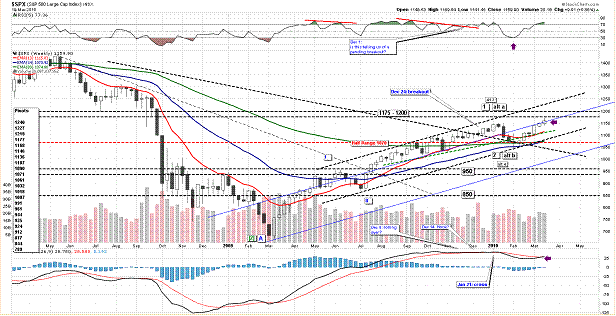
Notice that index has risen all the way to the middle of the channel, MACD’s at a kissing point, and RSI has entered overbought region. It is not very clear from this chart but 34 and 89 EMA are also kissing. Index is at a stage where it needs a good push (aka money on the bid side). It needs to receive money early next week or we may see more profit taking and perhaps softness/correction.
To the upside, there is some resistance around 1200.
To the downside, there is good support from MAs , but index could easily drop, on this weekly chart, to the neighborhood of 1120 before meeting its first MA.
This is daily chart of the index
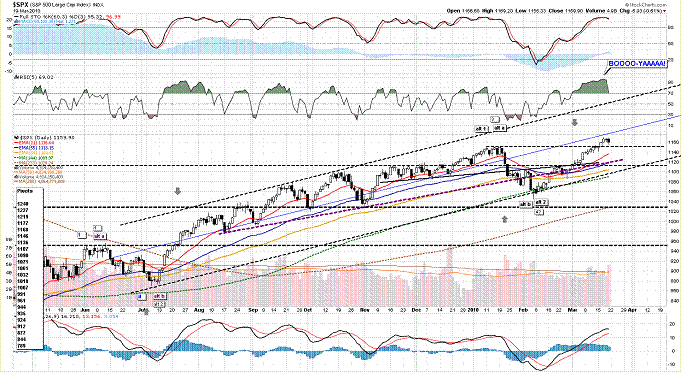
First off, look at that RSI peak!
I leave it to you to find out how many times in the past we have had that kind of peak and what the consequences were during the following days and weeks.
Index is at a new high for the year. It has a very positive technical profile. A first line of support is around 1146 pivot. Below that, there is ample support from a host of MAs, and technical levels. That being said, index looks overbought, daily price has put a bit of distance between price and MAs. Although overbought can stay overbought for a long time, I do not think it prudent to establish a new long position at this point. For positions from lower levels, one may need to re-evaluate based on one’s risk parameters and tolerance.
Friday was a down day on poor breadth and above average volume
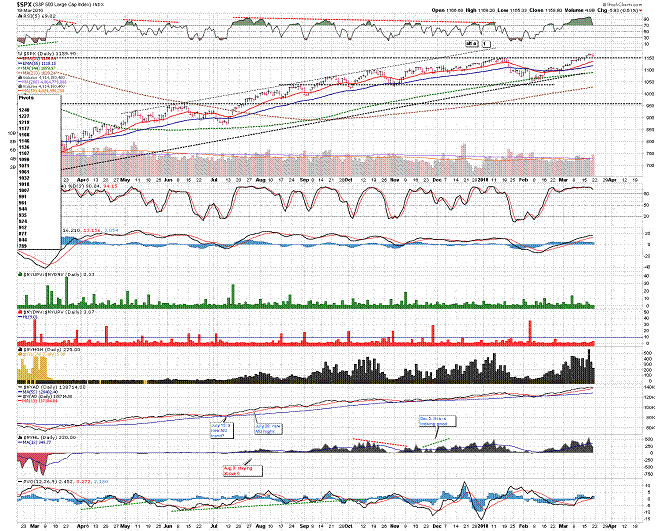
I mentioned that McClellan Oscillator looked like it was setting up a negative divergence in overbought areas. It did that and dropped sharply to neutral.
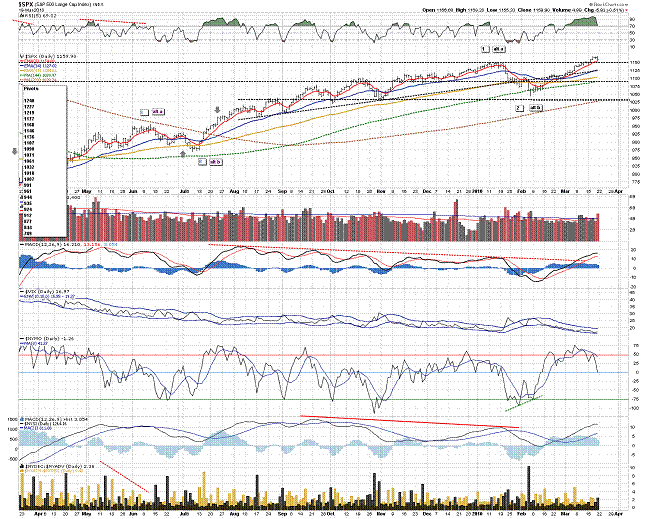
This is 60-min chart of the index
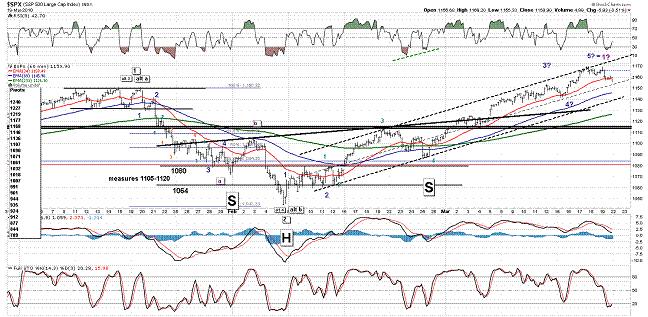
First off, the Inv. H&S that I first discuss on March 2, has worked very well – congratulations to those who took it. It is almost fully priced (pattern is spent) and I will remove its labels. But I shall keep the neckline as a viable technical support.
As price starts a move, we start examining possible paths that it might take. Later, we evaluate possibilities and decide on what path may be more probable than others. We then monitor the progress and adjust, or abandon if necessary. One tool than can tell us if a perceived price path is indeed behaving as it should is a well-constructed channel.
Notice the channel on the 60-min chart above. I started it on February 26. Since then, I have monitored price movement and commented on how I would have liked it to behave within the channel. On Friday, price hit the top of the channel and pulled back. First order of business for bears should be to bring the price down to the lower half of the channel. They need to do a lot of things to steal the show, but a move into the lower half of the channel is definitely a start.
We might have a completed wave pattern for a wave 1 up. It may also be argued as a wave B up.
Something I have noticed Elliot Wave does to some of its practitioners is that it gives them a sense of being right about the future path of the market. That sense, when turned into certainty, can frame the practitioner into a corner right where walls meet – hard to find a way out unless one does a complete turn and look the other way for probabilities. But looking the other way is hard when one is certain of the path the market should take in the future. With so many trying to tell the market what it should do, the ultimate contrarian play, IMO, may be to let the market tell me what I should do ;-)
As my friend Bill S. puts it: “E-wave when practiced correctly and in an unbiased manner is merely a tool for providing a probable roadmap with probably being the key word. It is all about probabilities not certainties, and one must use other tools to assess those probabilities.”
That is exactly what it is, a tool, a superior tool, I think, but a tool and no more.
OK, we have the possibility of a complete pattern. If so, the high of yesterday should ideally not be exceeded until the correction has run its course. That having been said, 60-min chart is oversold and we may see a bounce.
One day of selling on an expiration day does not break a market. It might however be a warning that more selling may follow to, at least, cool things off. So, I shall evaluate my levels, and watch for more signs of distribution.
This is still a bull’s market, so, I shall pay more attention to what bulls do as they have the upper hand, the capital, and the confidence, and less to what bears say – watch for signs of distribution!
There were talks of 1987 crash and comparisons made between now and then. All I can say is that it is dangerous to start a new long position in an overbought market. As for existing position, one must evaluate one’s position and take appropriate risk mitigating actions (hedging, insurance, re-balancing, profit-taking, whatever). That is just good discipline and has nothing to do with talks, innuendo, fears and trepidations of others. As for the crash, if it happens, some will take credit for having known it all along, if it does not happen, they will move on and tell us other stories.
Support is at 1148 and 1136. Resistance is at 1168 and 1177.
Long term trend is up. Mid-term trend is up. Short term trend is up (a move below 1140 may change that).
Have a Nice Week!
By Piazzi
http://markettime.blogspot.com/
I am a self taught market participant with more than 12 years of managing my own money. My main approach is to study macro level conditions affecting the markets, and then use technical analysis to either find opportunities or stay out of trouble. Staying out of trouble (a.k.a Loss) is more important to me than making profits. In addition to my self studies of the markets, I have studied Objective Elliott Wave (OEW) under tutorship of Tony Caldaro.
© 2010 Copyright Piazzi - All Rights Reserved Disclaimer: The above is a matter of opinion provided for general information purposes only and is not intended as investment advice. Information and analysis above are derived from sources and utilising methods believed to be reliable, but we cannot accept responsibility for any losses you may incur as a result of this analysis. Individuals should consult with their personal financial advisors.
© 2005-2022 http://www.MarketOracle.co.uk - The Market Oracle is a FREE Daily Financial Markets Analysis & Forecasting online publication.


