


Tracking Stock Market Cycles with Long Wave Dynamics and Theory 144
Stock-Markets / Cycles Analysis Apr 14, 2010 - 11:17 AM GMT

 In the 1920s Russian economist Nikolai Kondratieff discovered that international free market capitalism experiences regular boom and bust cycles, he called them long waves. Investors and traders commonly view the long wave as an obscure unproven theory, without profitable application to modern financial markets. Growing evidence suggests that such an assessment of the long wave is a costly error, for both investors and traders.
Research at LongWaveDynamics.com (LWD) indicates the global economy and financial markets are now in the expected stock market recovery of the final business cycle (aka Kitchin cycle) of the current long wave. The economic recovery thus far appears to be a sub-par inventory build cycle that will top in 2010. Global equity markets typically top out in advance of economic activity. Employment recovery during this business cycle is proving to be the weakest of any recovery since the 1930s. This is precisely because the long wave winter season is producing gale force structural headwinds for the global economy. Once this weak inventory build regular business cycle loses steam, evidence suggests that a global debt collapse will take Mr. Market with it into a final long wave bottom in 2012.
Market Oracle readers were presented the chart below several weeks ago. Further elaboration on its implications for the market’s future is required. This chart serves as a long wave dynamics introduction that allows readers to drill down to additional charts that demonstrate a new school of technical analysis known as Theory 144.
The current long wave began in 1949; Robert Prechter first identified this beginning year of the current long wave. Many charts in commodities, interest rates and equity markets, especially inflation-adjusted charts, validate this long wave start. The S&P 500 chart presented below demonstrates the power of the long wave in action. This chart is the inflation adjusted 20-year return chart on the S&P 500. It strips out the market noise and shows you the real return on investments in equities over the long run. Maybe this is what Keynes had in mind with he said, “In the long run, we’re all dead”. Stalin had Kondratieff killed because he concluded that a market economy would come back stronger than ever after the long wave decline has run its course. Maybe Keynes had a valid point after all.
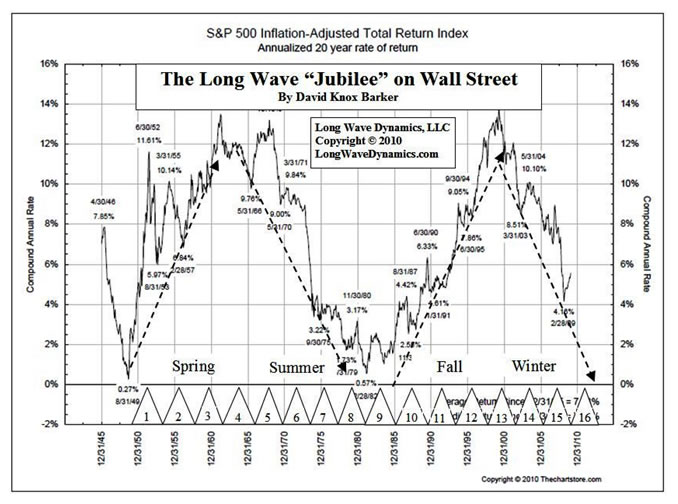
What investors and traders need to grasp is that the essential nature of the long wave is that it represents the long-term ebb and flow of global corporate efficiency, but also contains implications and cycle DNA for technical analysis of the smaller cycles. A review of all four long wave seasons and their impact on corporate efficiency may be helpful for those unfamiliar with such a practical approach to long wave dynamics. 1) During the spring season, corporate efficiency is booming. Removal of excess capacity funded by debt that could not earn a sufficient return after debt servicing occurs during the winter season through corporate failure and bankruptcy. Therefore, pricing power returns to global markets during the long wave spring. Innovations are creating new products that deliver better profits than the old mature products and markets. New markets are emerging and providing room for growth. 2) During the summer season rising raw material prices, tight labor markets, rising competition and increasing costs of debt squeeze profit margins. 3) The fall season sees corporate efficiency return with falling raw material costs, lower borrowing costs in the form of interest rates and improving profit margins and cash flows, speculation surges. 4) In the long wave winter overcapacity, competition, debt and the ensuing loss of pricing power squeezes profits and corporate efficiency takes in on the chin, cash flow contracts. What ultimately drives an investor’s willingness to own a company’s stock is corporate efficiency. At the end of the day, corporate efficiency determines the ability of the company to generate cash for shareholders, and that is ultimately why you own a stock as an investor.
What the total return inflation-adjusted S&P 500 chart suggests is that the global long wave in equities prices is essentially a global corporate cash flow indicator. The forecast at LWD is that the long wave cash flow generation indicator will turn down hard as the current regular business cycle disappoints investors as only a weak inventory build cycle. The continued destruction of corporate efficiency wrought from the long wave winter forces of global overproduction and excessive debt will resume. The idea that you could cancel such powerful global long wave forces at work by shifting private debt onto government balance sheets and then piling on additional sovereign debt is nonsense. The government’s balance sheet is an extension of the taxpayer’s balance sheet, which taxpayers will soon learn to appreciate.
The new updated and expanded edition of, Jubilee on Wall Street; An Optimistic Look at the Global Financial Crash (2009) examines the current long wave’s status and includes 24 long wave charts. McGraw-Hill last published the book as The K Wave (1995). The last edition contained charts that projected the end of the current long wave in 2009, driven to its grave by a global real estate bust, international banking crisis, crashing stock markets and a crisis of capitalism. It would be great to report that the last edition precisely nailed the bottom of the long wave from 15 years out. However, from the vantage point of the present ongoing global crisis, aggressive fiscal and monetary policy has expanded the most recent business cycles into longer cycles. This has served to lengthen the current long wave. The global crisis into 2009 was merely Act I of the most recent long wave tragedy being played out on the global stage.
Emerging markets will come on strong in the new long wave spring season that lies ahead. This is already occurring to various degrees, so a global 2009 inflation-adjusted long wave bottom scenario remains a small possibility. However, global overproduction and burdensome debt, even in many emerging markets, suggests that emerging markets are not yet mature enough to pull developed economies out of their long wave debt induced slump. In short, it looks like 2012 is the more likely bottom of the current long wave that will give birth to the new long wave spring season.
Skeptics will of course inquire, and rightfully so, as to how it can be ascertained that we are in the final business cycle of a long wave winter season. Most students of markets are aware that Harvard economist Joseph Schumpeter, author of the two-volume set Business Cycles, was a long wave analyst. Schumpeter’s understanding of long waves is how he came to recognize the value of the creative destruction of capitalism. A less well-known fact about Schumpeter is that he presented a model of the long wave that included 18 regular business cycles in every long wave.
Long after Schumpeter’s work, market analyst PQ Wall offered an alternative scenario and cycle model that proposed 16 regular business cycles in every long wave. Based on years of cycle research, we have dropped Schumpeter’s model and come to endorse the PQ Wall model of business cycles as relates to the long wave. PQ’s approach allows a more accurate and useful unified theory of cycles. Extensive research suggests the Wall approach is highly useful for investors and traders.
As the S&P chart above demonstrates, every long wave has four seasons. The seasonal approach to long waves likely has its origins in the writings of Oswald Spengler, The Decline of the West, who took a seasonal approach to large social cycles on the scale of world empires. Each season in the long wave has four regular business cycles. This produces PQ’s 16 regular business cycles in a long wave.
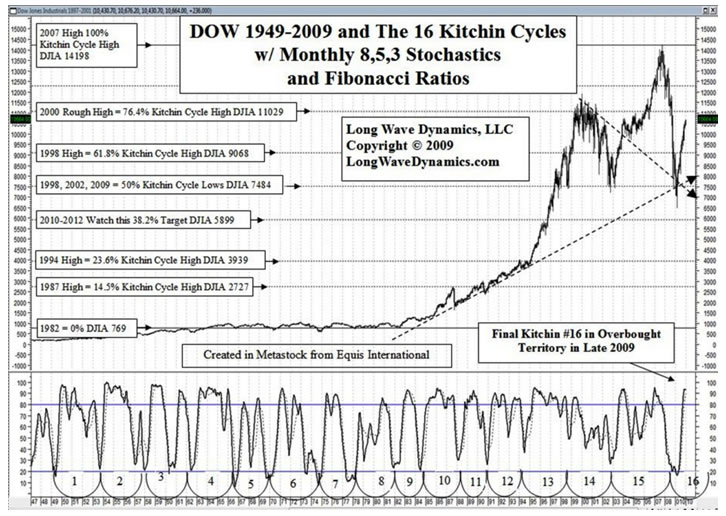
The DJIA chart below demonstrates the 16 Kitchin cycles in the current long wave. Mr. Market appears to have climbed the front end of Kitchin cycle number 16, and is now in the overbought range on the stochastics. The DJIA has penetrated and is testing the Level 1 Fibonacci 76.4% price target of 11,029 on this chart currently. The taxpayer-backstopped liquidity driven stock market rally on the front the final inventory build business cycle of this long wave is now richly valued. Additional government and central bank programs may provide additional market fuel. However, once top tick occurs, we suspect here in 2010, and sooner rather than later, it will be a hard ride down into 2012, so buckle up.
The Mayans have nothing to do with the cycle count for a long wave ending in 2012. The fiscal and monetary policies of our friends in Washington, Brussels and Beijing that have tried to protect the world from the consequences of financial folly have managed to delay the day of debt reckoning. They simply expanded the prior business cycles, and therefore we now find ourselves in the final business cycle #16 of this long wave.
The work of Jay Forrester in the System Dynamics Group at MIT has validated the long wave perspective. In a speech by Forrester in 2003, he noted that aggressive fiscal and monetary policy will expand the cycles, only postponing the inevitable long wave debt crisis. It appears as if the inevitable is now on the doorstep of the global economy.
LWD stock market cycle research caters to both investors and traders. Accurate analysis of the long wave, the long wave seasons, and the regular business cycle is essential. Cycle analysis is a form of “formula timing plan”, in the words of Benjamin Graham. It provides a method for timing when to get into investments or when to exit investments where the investor also applies the principles of value investing and discounted future cash flows.
For traders, this is where the long wave dynamics and Theory 144 approach to tracking stock market cycles gets interesting. PQ Wall’s cycle model utilized what he termed the inherent threeness and fourness in relationships between the different levels of cycles. Using his methods of cycle analysis and divisibility, you drill down to what most traders recognize as the 20-week cycle. The 1995 edition of our book rechristened the 20-week cycle as the Wall cycle, in honor of PQ Wall, the man who discovered the relationship of the 20-week cycle to the larger cycles and the long wave. Investors and traders need to realize an important fact about the Wall cycle; the Wall cycle is technically a miniature long wave. The Wall cycle is a long wave divided by 144.
PQ was fond of quoting this author as saying, “There are but three original theories of technical analysis: Gann, Elliott and Wall.” This remains true. However, when you add Fibonacci in price and time to Wall, an entirely new world of technical analysis opens up with astounding potential. LWD research picks up where Wall left off with additional technical methods he did not deploy. Additional research, using Fibonacci in price and time and stochastics has validated the smaller cycle count in the long wave as described by Wall.
The extended technical analysis methodology that takes Wall’s remarkable work to the next level is Theory 144. This new school of technical analysis provides a great deal of practical application for traders using the smaller cycles, and provides an actionable larger cycle framework for analysis and decision making for investors.
Most sophisticated traders and investors are aware of the power of Fibonacci in market price action. In the mid-1990s, further research discovered ideal lengths in cycles by using Fibonacci ratios in time around ideal target dates for cycle endings. The discovery of ideal cycle lengths has a major implication on cycle and technical analysis research. Occasionally a cycle ends exactly on its ideal length, but more often than not, they bottom and a new cycle begins at a Fibonacci ratio to the ideal in time.
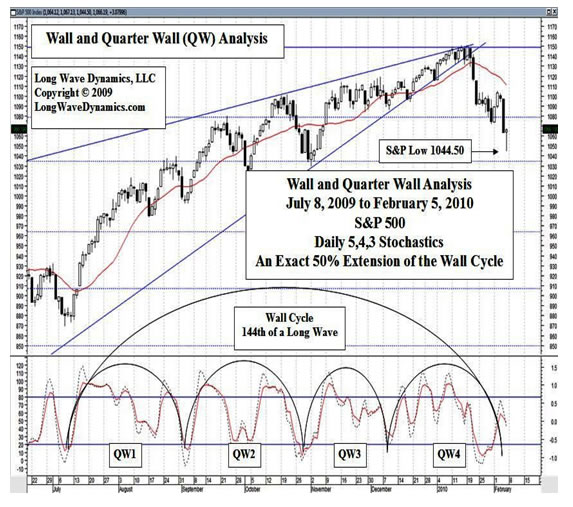
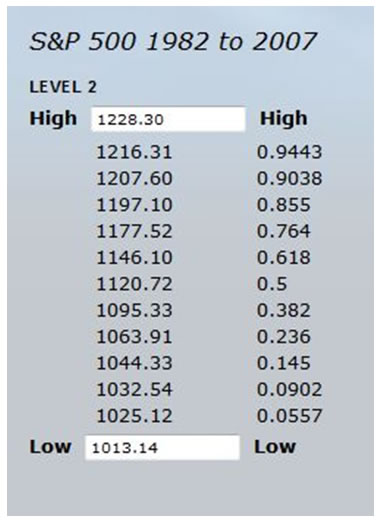
A recent example of this new cycle and technical analysis method is the February 5th bottom of the Wall cycle. For several months in advance, this specific date was on the LWD radar as a possible bottom of the Wall cycle. Why? Because it was an exact Fibonacci 50% extension of the ideal length of the Wall cycle that bottomed on July 8, 2009. The February 2010 LWD letter was published on February 5th with the above chart; identifying the end of a 50% Fibonacci ratio extended Wall cycle bottom and turn date, which proved to be an important bottom. Not only that, the market bottomed intraday at 1044.50, almost exactly on one of our Fibonacci price targets of 1044.33 on the S&P, a Level 2 Fibonacci 14.5% ratio target price. The market surged from this February 5, 2010 low, as forecasted. Traders will recognize how Mr. Market has respected the other Level 2 Fibonacci price targets on this grid.
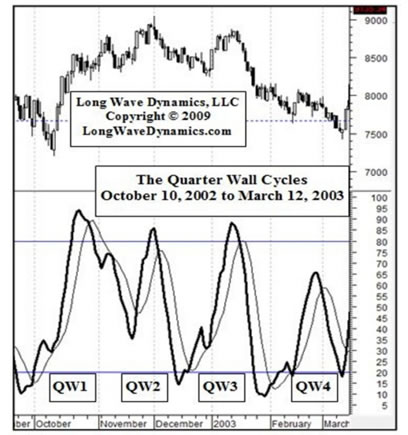
Coincidence? Consider the chart below. Not only was the Wall cycle from October 10, 2002 to March 12, 2003 within one day of the Fibonacci 14.5% ratio extension target date, but with daily stochastics the four Quarter Wall cycles that make up that Wall cycle are distinct. In fact, they jump off the page. This is just one of many examples. Virtually every Wall cycle confirms this new method for technical analysis with Fibonacci targets in price and time, a promising new method of technical analysis. LongWaveDynamics.com Wall and Quarter Wall cycle price and time targets will rock your world of technical analysis.
For traders, LWD focuses on the smaller cycles of the Wall cycle and the Quarter Wall cycle. Knowledge of the long wave family of cycles, Fibonacci in price and time, and stochastics allow for high probability identification of the turning points of the tops and bottoms of these cycles for traders.
Investors, i.e, those who buy stocks based on a discounted future cash flow approach can also apply this cycle research. Getting clear of overvalued markets in light of analysis of the larger cycles is advisable for investors. Traders, i.e., those who capitalize on short-term price movements, can make hay with the smaller cycles along the way. A solid understanding of the long wave and the Wall and Quarter Wall cycles, and a disciplined application of cycle analysis in a trader’s repertoire of trading tools is more essential than ever.
For investors, traders, and not to mention hourly workers around the world, the global economy could have emerged into a new global long wave season from the 2009 lows, driven by emerging markets. Instead, due to government intervention and aggressive monetary policy, the world now faces an unprecedented global debt collapse from all the debt piled on the world by the failing efforts of state capitalism to stop the inevitable long wave winter season.
A growing black hole of global debt appears to be pulling the global economy toward the quintessential black swan event of uncontained sovereign debt defaults and deflation. Analysis at LongWaveDynamics.com suggests the global economy has a meeting with destiny in the final year of the long wave winter season of 2012. Consider yourself warned. Coming out the other side a new golden age for international free market capitalism will dawn. Adam Smith called it The Great Republic.
David Knox Barker is a long wave analyst, technical market analyst, world-systems analyst and author of Jubilee on Wall Street; An Optimistic Look at the Global Financial Crash, Updated and Expanded Edition (2009). He is the founder of LongWaveDynamics.com, and the publisher and editor of The Long Wave Dynamics Letter and the LWD Weekly Update Blog. Barker has studied and researched the Kondratieff long wave “Jubilee” cycle for over 25 years. He is one of the world’s foremost experts on the economic long wave. Barker was also founder and CEO for ten years from 1997 to 2007 of a successful life sciences research and marketing services company, serving a majority of the top 20 global life science companies. Barker holds a bachelor’s degree in finance and a master’s degree in political science. He enjoys reading, running and discussing big ideas with family and friends.
© 2010 Copyright David Knox Barker - All Rights Reserved Disclaimer: The above is a matter of opinion provided for general information purposes only and is not intended as investment advice. Information and analysis above are derived from sources and utilising methods believed to be reliable, but we cannot accept responsibility for any losses you may incur as a result of this analysis. Individuals should consult with their personal financial advisors.
© 2005-2022 http://www.MarketOracle.co.uk - The Market Oracle is a FREE Daily Financial Markets Analysis & Forecasting online publication.