


This Is For All You Stocks Bull Market Geniuses
Stock-Markets / Stock Index Trading May 07, 2010 - 10:49 AM GMTBy: Guy_Lerner

Figure 1 is the "Dumb Money" indicator. This is the same indicator I show every weekend in our report on sentiment; the indicator will updated this weekend. The "Dumb Money" indicator looks for extremes in the data from 4 different groups of investors who historically have been wrong on the market: 1) Investor Intelligence; 2) Market Vane; 3) American Association of Individual Investors; and 4) the put call ratio.
Figure 1. "Dumb Money" indicator/ weekly
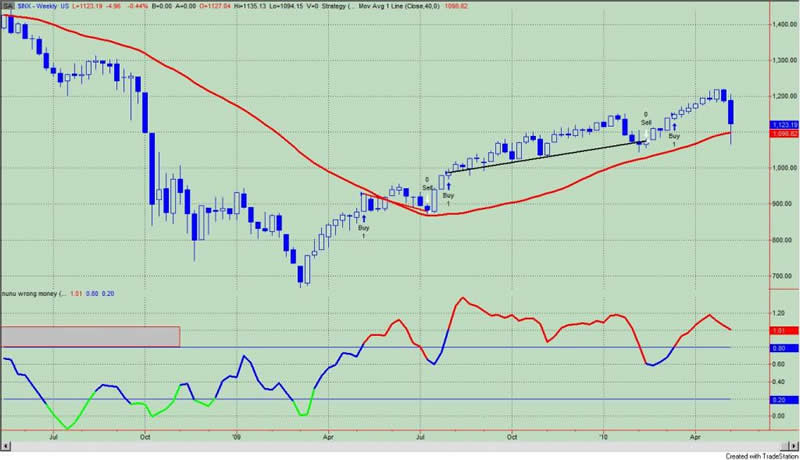
Since March, 2009, the "Dumb Money" indicator has been bullish to an extreme degree on 3 separate occasions, and typically, these are bearish signals suggesting that a price move is either nearing its end or the ascent of prices is surely to show. This is our expectation 85% of the time. In figure 1, this would be when the indicator is red in color.
For months on end, I have heard from those investors (i.e., bull market geniuses) who categorically and emphatically stated that this stuff doesn't work anymore. Of course, none of these bull market geniuses knew what was working either or bothered to offer alternatives or insight. But suffice it to say, a bull market covers up a lot of bad analysis.
Anyway, because I deal in numbers and those bull market geniuses don't, I thought we would look at the 3 instances since March, 2009 where the "Dumb Money" indicator was extremely bullish (i.e., bear signal) and see how things turned out.
The first time the "Dumb Money" indicator was in the extreme zone showing too many bulls was on May 8, 2009. This lasted until July 10, 2009. The return for the S&P500 over that period was a NEGATIVE 5.39%. The second instance was from July 31, 2009 to February 2, 2010. During this 29 weeks of bull market hype and other nonsense, the S&P500 gained a POSITIVE 8.91%. The last instance started on March 12, 2010 and the indicator still remains in the extreme bullish zone. As of Friday morning, that signal has returned a NEGATIVE 3.5%.
So let's assume that as a bull market genius, who bought the hype, you are so smart that you bought and sold the S&P500 only during those times when the indicator was in the extreme bullish zone (i.e., bear signal). In other words over the last 14 months, you were only long the market when the indicator in figure 1 was red in color. Now let's do a little math and add up the returns over those 3 periods, and we get a total return of 0%. Nada, nothing, zip!!
Since the March, 2009 lows, 61 weeks of time have passed. The 3 periods highlighted above in our little study account for 48 weeks of that time. The gains from March 13, 2009 to the present (Friday morning) are about 48%. The 48 weeks where investor sentiment was extremely bullish as determined by the "Dumb Money" indicator did not contribute at all to those gains - nothing.
So for all you bull market geniuses out there, you have earned exactly what you deserve --nothing!
By Guy Lerner
http://thetechnicaltakedotcom.blogspot.com/
Guy M. Lerner, MD is the founder of ARL Advisers, LLC and managing partner of ARL Investment Partners, L.P. Dr. Lerner utilizes a research driven approach to determine those factors which lead to sustainable moves in the markets. He has developed many proprietary tools and trading models in his quest to outperform. Over the past four years, Lerner has shared his innovative approach with the readers of RealMoney.com and TheStreet.com as a featured columnist. He has been a regular guest on the Money Man Radio Show, DEX-TV, routinely published in the some of the most widely-read financial publications and has been a marquee speaker at financial seminars around the world.
© 2010 Copyright Guy Lerner - All Rights Reserved
Disclaimer: The above is a matter of opinion provided for general information purposes only and is not intended as investment advice. Information and analysis above are derived from sources and utilising methods believed to be reliable, but we cannot accept responsibility for any losses you may incur as a result of this analysis. Individuals should consult with their personal financial advisors.
Guy Lerner Archive |
© 2005-2022 http://www.MarketOracle.co.uk - The Market Oracle is a FREE Daily Financial Markets Analysis & Forecasting online publication.