


Is the Stock Market Trend Ready to Repeat Itself?
Stock-Markets / Stock Markets 2010 Jun 13, 2010 - 07:03 AM GMTBy: JD_Rosendahl

 If we make the assumption the bottom of this leg down from the April top is done then the most common expectations are a bullish new high or a bearish right shoulder.
The bullish view is off to a new high. There's not enough technical damage to rule this out. It's not my primary view, but it's still viable. See weekly chart below for what that might look like.
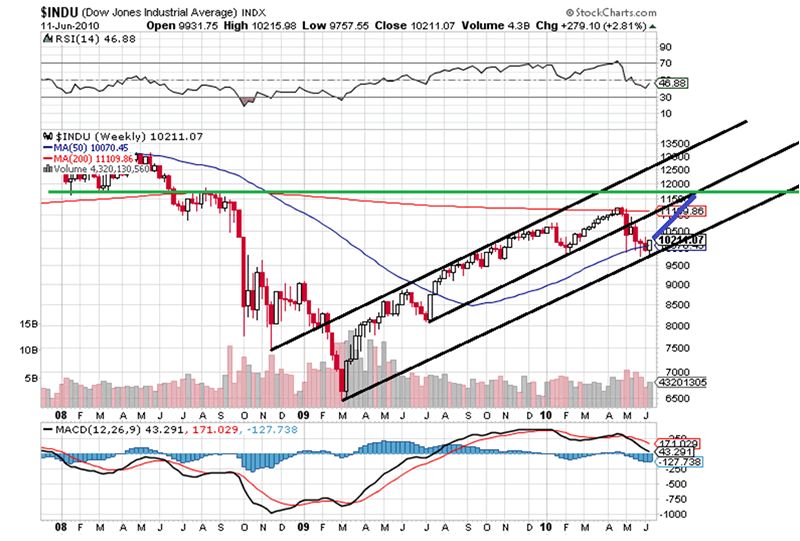
In the above view, the market would move into a new high. Something just above the prior high and the 200 day MA at 11,200, or maybe up to resistance (green and black lines) at 11,700.
What’s far more interesting is the bearish view in the technical analysis of a potential head and shoulders top. Is the market ready to repeat itself? I’m using the weekly chart below of the DOW to highlight what could be a repeat of price and technical structure.
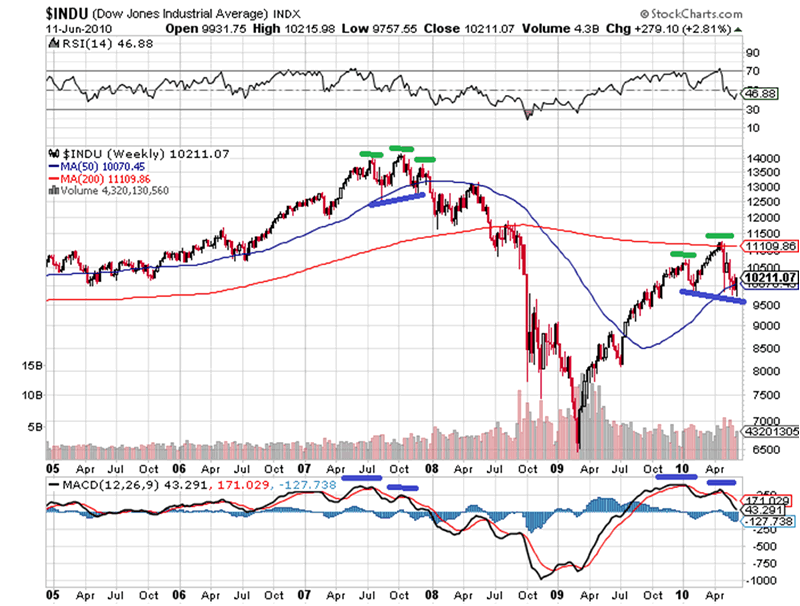
The DOW made a head and shoulders top in late 2007 with clear divergences on the weekly MACD on the left shoulder versus the head. We have the same set up now on the MACD with divergences on the potential head compared to the left shoulder.
In 2007, the weekly MACD declined from the head with price finding a short term bottom at the neckline and then bounced while the MACD tried back testing itself in Nov/Dec. 2007. All it really did was burning off over sold conditions on shorter time frames like the daily. Then it failed with price and a correction begin.
If we expect the head and shoulders top this time, it's conceivable to expect a similar dynamic. We should look for the market to bounce, while the weekly MACD back tests itself, but then fails with price.
In the 2007 pattern, it only took three weeks for the bounce into right shoulder. If we take a look at the fall from the January 2010 high (left shoulder) to the neckline it lasted 3-4 weeks, and it’s logical to expect the forming of the right shoulder to take 3-4 weeks or end of June early July, if we're repeating ourselves.
In 2007, that bounce into the right shoulder was roughly 1000 points, which is about the price fall from the January 2010 high to the neckline, and about the increase needed to bounce up into the upper Fibonacci retracement levels in the chart below.
The above potential right should is the 50% and 62% retracement levels.
It won’t take long to see if this is developing. Look for volume to dry up on the move up, classic right shoulder behavior. Look for the markets to stall in the retracement zone mentioned above or slightly above it. Look for the weekly MACD to fail turning up while burning off over sold conditions on shorter time frames, like the daily chart. And, my personal favorite on a head and shoulders pattern, look for the right should to make a topping pattern, maybe a smaller H&S top.
By J.D. Rosendahl
www.roseysoutlook.blogspot.com
J.D. Rosendahl was a former stock broker/investment consultant (currently not licensed) before becoming a Commercial Banker for the past 14 years. He manages his family's wealth, helping them avoid the high tech bubble and the real estate bubble melt downs and preserving wealth.
© 2010 Copyright J.D. Rosendahl - All Rights Reserved
Disclaimer: The above is a matter of opinion provided for general information purposes only and is not intended as investment advice. Information and analysis above are derived from sources and utilising methods believed to be reliable, but we cannot accept responsibility for any losses you may incur as a result of this analysis. Individuals should consult with their personal financial advisors.
© 2005-2022 http://www.MarketOracle.co.uk - The Market Oracle is a FREE Daily Financial Markets Analysis & Forecasting online publication.