


Stock Market Ominous Signs!
Stock-Markets / Stock Markets 2010 Jun 22, 2010 - 01:45 PM GMTBy: Steve_Betts

 “Regulation was the obvious method of keeping corporations answerable to democracy, and not the other way around – but why trust public officials to regulate if they were all on the take?... The power of the railroads (today, banks) gave rise to demands for a stronger government to control them, yet this same power aroused fears that they would simply corrupt a strong government, and grow still more powerful.” --- T.J. Stiles in “The First Tycoon,” regarding the life of Cornelius Vanderbilt in 1860
I’m just thinking out loud but I read that J P Morgan holds close to 24% of the common shares of BP. Obviously that is a substantial amount of money. Then BP goes to the Whitehouse and a deal is made. All we know is that a fund will be creates for US $40 billion but details are scarce. The company’s market cap is close to US $90 billion so that means 45% of the shareholder value just went down the tubes, and yet everyone seems to go home happy. I also know that BP has made donations to most of the politicians along the Gulf Coast and to Obama’s campaign. According to a recent article most of the sitting Federal judges along the Gulf Coast have “financial connections” to big oil in one form or another. Then I know that the Fed is involved in the bailout of European sovereign debt and I really have to ask myself where the US $40 billion is coming from? Could it be that the American taxpayer is going to get the shaft yet again? Just a thought!
Whenever I want to know the truth I go and look at the charts and numbers while leaving the TV on mute. If the folk’s on TV really knew what was going on, they’d be too busy watching the market to talk about it all day long. Recently I received this chart from a client and then I read that Richard Russell talked about one of the biggest market tops in history, and I think this is what he was referring to:
It’s a huge head-and-shoulders formation with a neckline around the 50% retracement of the entire bull market at 7,470. The question now is whether or not it’s completed the right shoulder, and I believe it has. The right shoulder stopped just 7 points beyond the .618 retracement of the last big move down and I don’t think that was an accident.
You may recall that in the gold charts we saw three head-and-shoulders formations develop over the last two and a half years, an unusual occurrence to say the least. Now in the Dow we have the huge formation above and the smaller formation pictured below:
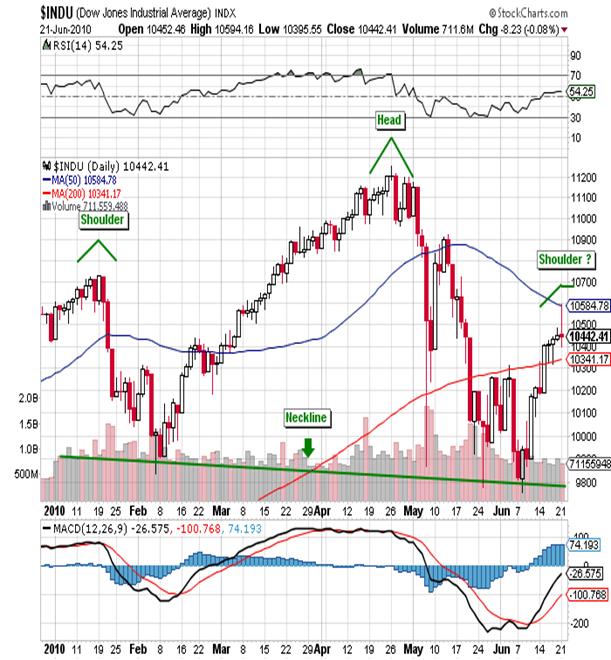
Personally I have had doubts with respect to this formation as it looks more like a series of lower highs than a true head-and-shoulders formation, but I don’t want to split hairs. Stock prices are rich to say the least, PER’s are meaningless due to the fact that balance sheets and profits are fictitious, debt is now considered an asset, and the list goes on.
Volatility bears watching as it fell all the way down to the 200-dma during the Monday morning session and then recovered to close up .93 at 24.88 as you can see below:
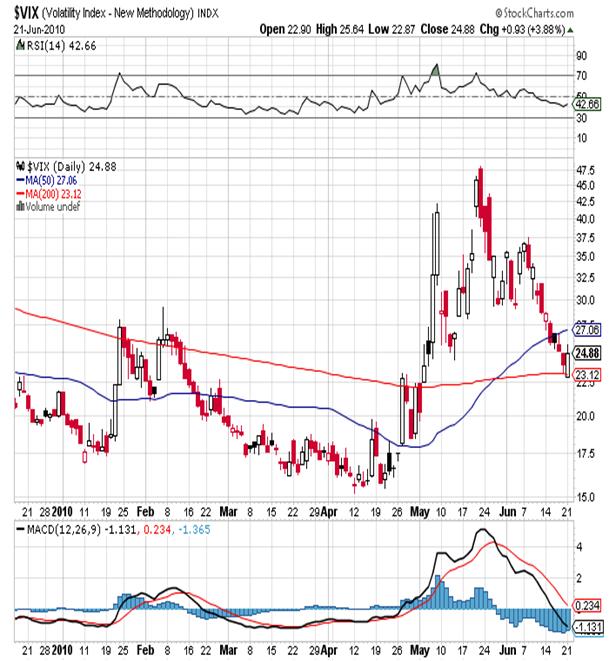
Monday saw a lower low as compared to Friday and then rallied to a higher high and missed out on a upside reversal by one one-hundredth of a point, thanks in part to the fact that someone bought the Dow going into the close. I suspect the 200-dma will hold and now we’ll see the VIX head higher over the coming weeks. At 1 pm EST today the VIX is up slightly.
Finally, I want to close out this discussion by looking at two charts. The first is a daily chart of the Shanghai Stock Exchange and it is important because it is the country with the most reserves. That means it is best able to fend off the economic devils currently tormenting other economies:
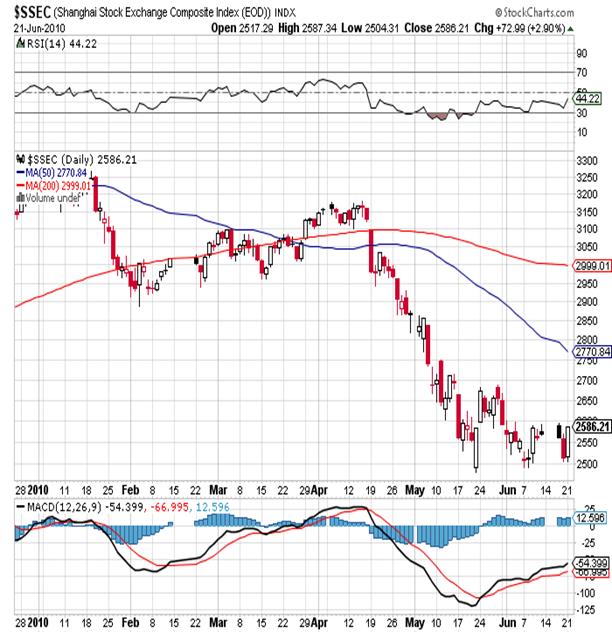
Note how the Shanghai Exchange failed to rally with the Dow over the last ten sessions. I find that quite ominous to say the least. Then they had a good 2.5% rally on the “news” the Yuan would float, but with no follow through the next day (not shown). Again, ominous! If you don’t believe your own bullshit, how do you expect anyone else to buy into it? Now look at this daily chart of the Baltic Dry Index:
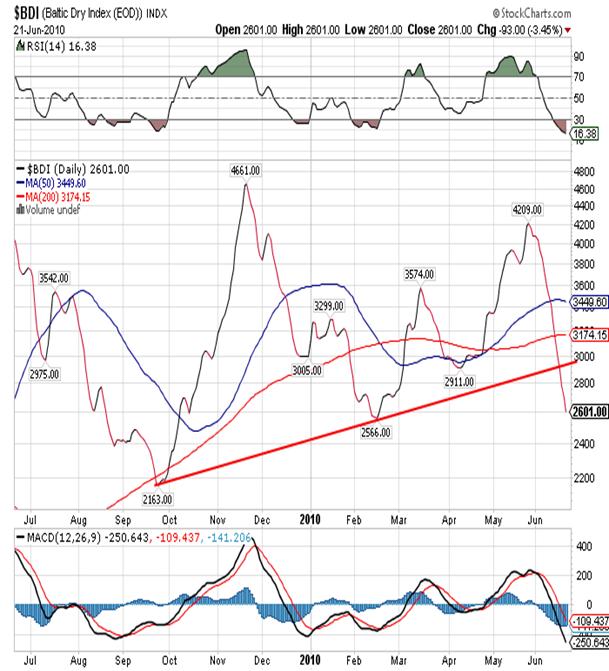
Think of this chart as a reflection of the worldwide demand for dry goods, and then note that it has broken down completely. Again, this is an ominous event!
In conclusion we live in a world where hope is abundant. It’s fed to us daily by the financial news networks, and it’s almost un-American to speak against hope. Reality is whatever Bloomberg says it is. My experience is that hope is food for the masses, and it is the last asset you have on your balance sheet before you come to the realization that you’re bankrupt! The average investor ignores the fact that his IRA is worth less than it was two or three years ago, that Social Security is bankrupt and Medicare is worthless, and that he is swimming in debt and his dollar buys less than it did ten years ago. He reads his Sunday paper and takes relief from the fact that Obama will “kick some ass”. Then he goes to sleep Sunday night hoping that somehow it will all work out. Lately he’s been waking up at 3 am with an uneasy feeling, but he keeps telling himself to ignore it.
He’s bought the company line that he can spend beyond his means and credit is an asset for so long that he doesn’t know any other way to think. His world is full of half truths: look at the stock market; it’s gone up 40% since March 2009! It’s never mentioned that if you bought the Dow in 2000 or 2006, your portfolio would be underwater today. Don’t even stop to consider where the Dow would be if the same 30 stocks in 2000 were in the Dow today! So much for investing for the long run! All of these realizations are just beginning to hit home, and when they do panic will set in. That’s where we are today; on the verge of panic. His solution is to ignore reality. God forbid he takes positive action, like buying gold for instance. Hell, he doesn’t even know gold exists and he sure doesn’t know that it has risen four fold since 2000. That’s all by design. Never give a sucker a way out!
PORTFOLIO SUMMARY (thru June 21st)
CONTRACT ACTION # INITIAL PRICE CLOSING PRICE GAIN
Sept Dow Short 2 10,210 10,370 -3,254
Mini-SepDow Short 1 9,850 10,370 -2,613
Dec Gold Long 1 1,219.0 1,233.5 1,450
Dec Gold Long 1 1,248.0 1,235.0 -1,300
July Copper Short 1 293.0 293.0 -300
Aug Oil Short 1 79.65 78.21 1,550
*Sept Bond Short 1 124.08 123.28 341
*Position closed
[Please note that the new website at www.stockmarketbarometer.net will become operational this week. Also, note that you can contact us at our new e-mails, info@stockmarketbarometer.net (general inquiries regarding services), team@stockmarketbarometer.net (administrative issues) or analyst@stockmarketbarometer.net (any market related observations).]
By Steve BettsE-mail: analyst@stockmarketbarometer.net
Web site: www.stockmarketbarometer.net
The Stock Market Barometer: Properly Applied Information Is Power
Through the utilization of our service you'll begin to grasp that the market is a forward looking instrument. You'll cease to be a prisoner of the past and you'll stop looking to the financial news networks for answers that aren't there. The end result is an improvement in your trading account. Subscribers will enjoy forward looking Daily Reports that are not fixated on yesterday's news, complete with daily, weekly, and monthly charts. In addition, you'll have a password that allows access to historical information that is updated daily. Read a sample of our work, subscribe, and your service will begin the very next day
© 2010 Copyright The Stock Market Barometer- All Rights Reserved
Disclaimer: The above is a matter of opinion provided for general information purposes only and is not intended as investment advice. Information and analysis above are derived from sources and utilising methods believed to be reliable, but we cannot accept responsibility for any losses you may incur as a result of this analysis. Individuals should consult with their personal financial advisors.
© 2005-2022 http://www.MarketOracle.co.uk - The Market Oracle is a FREE Daily Financial Markets Analysis & Forecasting online publication.