


Stock Market Extremes in Bearish Sentiment Needs More Buyers
Stock-Markets / Stock Markets 2010 Jul 18, 2010 - 12:02 PM GMTBy: Guy_Lerner

 Without buyers stepping in, extremes in bearish sentiment will be just that - extremes in bearish sentiment. Prices not only ended the week on a big down note, but they also failed to close above resistance levels despite probing above those levels all week. This was just pure selling.
The smart money and company insiders continue to show little buying interest as well. Even the Rydex market timers appear to be sitting on their hands. The lack of volume on up days and the increased volume on down days is a lack of sponsorship - plain and simple. Buying has yet to surface, and until the markets clear the near by resistance levels on a weekly closing basis (i.e., 107.58 on the SPY and 45.01 on the QQQQ), this market remains suspect.
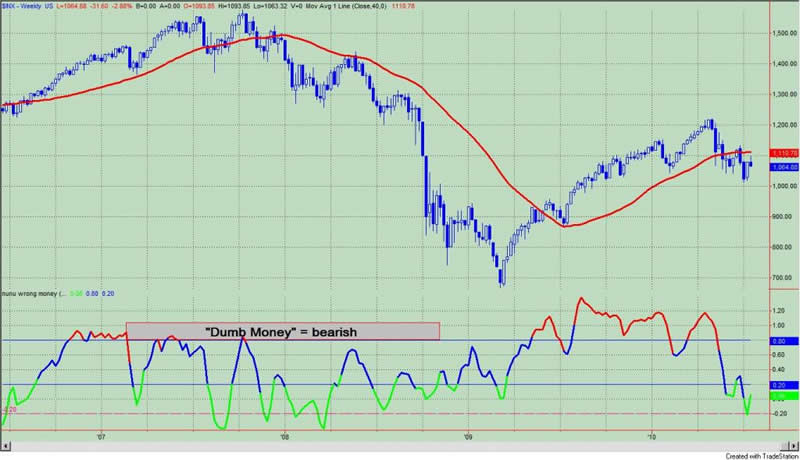
The "Dumb Money" indicator (see figure 1) looks for extremes in the data from 4 different groups of investors who historically have been wrong on the market: 1) Investor Intelligence; 2) Market Vane; 3) American Association of Individual Investors; and 4) the put call ratio. The "Dumb Money" indicator is now bearish for three weeks in a row.
Figure 1. "Dumb Money"/ weekly
The "Smart Money" indicator is shown in figure 2. The "smart money indicator is a composite of the following data: 1) public to specialist short ratio; 2) specialist short to total short ratio; 3) SP100 option traders. The "Smart Money" indicator is bullish/neutral as the smart money has shown little inclination to buy into this market.
Figure 2. "Smart Money"/weekly
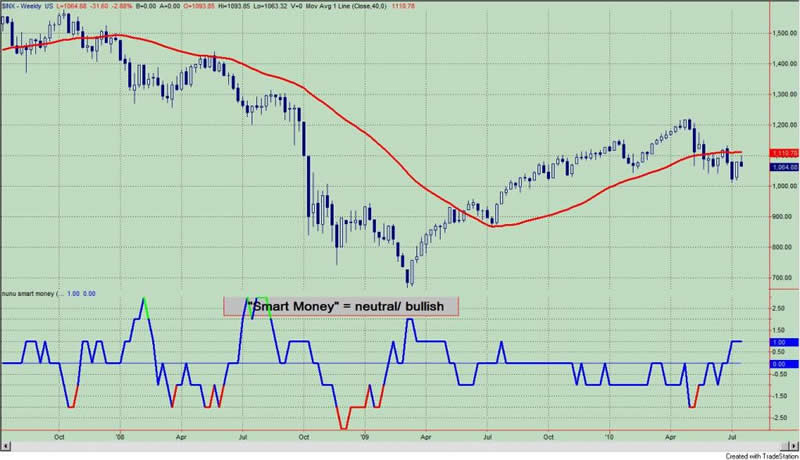
Figure 3 is a weekly chart of the S&P500 with the InsiderScore "entire market” value in the lower panel. From the InsiderScore weekly report: as with the prior weeks, transactional volume has slowed and insiders remained without conviction.
Figure 3. InsiderScore "Entire Market" Value/ weekly
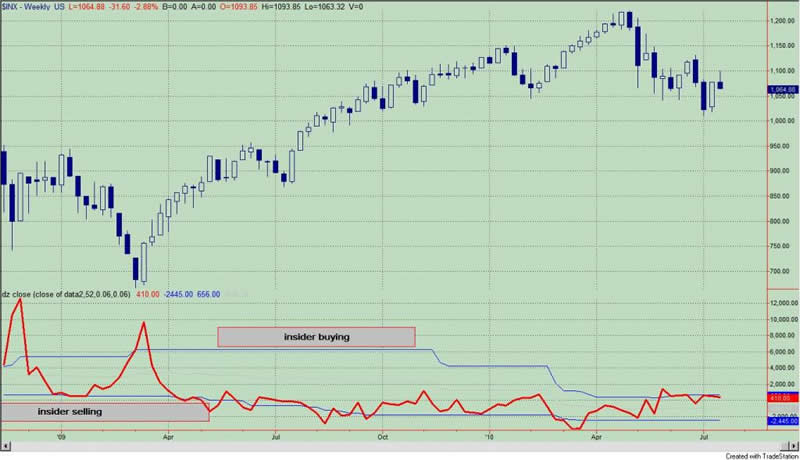
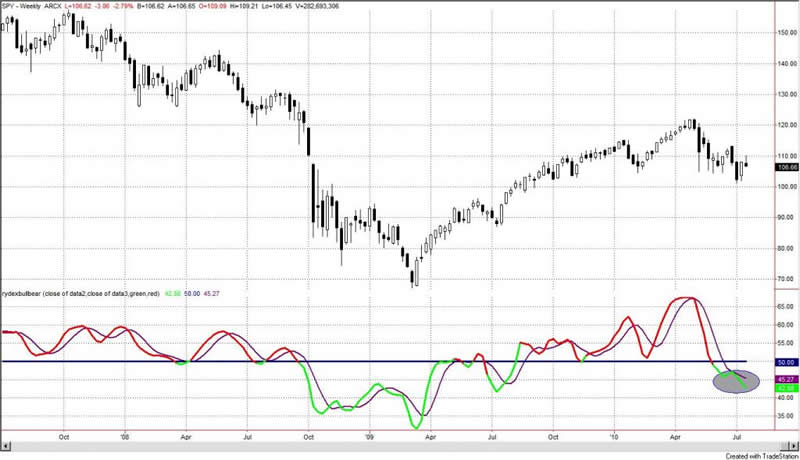
Figure 4 is a weekly chart of the S&P500. The indicator in the lower panel measures all the assets in the Rydex bullish oriented equity funds divided by the sum of assets in the bullish oriented equity funds plus the assets in the bearish oriented equity funds. When the indicator is green, the value is low and there is fear in the market; this is where market bottoms are forged. When the indicator is red, there is complacency in the market. There are too many bulls and this is when market advances stall.
Currently, the value of the indicator is 42.88%. Values less than 50% are associated with market bottoms. This is the lowest value since July, 2009. However, as discussed in a recent Rydex research report, the persistence of selling or lack of buying (as seen in this indicator) is most likely a sign of price weakness over the coming week.
Figure 4. Rydex Total Bull v. Total Bear/ weekly
Improve your market timing withPremium Content from TheTechnicalTake. For a nominal yearly fee, you will get a unique data set that will show you which way investors (i.e., bull market geniuses) are leaning.
It is independent and original market analysis. To view a recent report click: REPORT.
By Guy Lerner
http://thetechnicaltakedotcom.blogspot.com/
Guy M. Lerner, MD is the founder of ARL Advisers, LLC and managing partner of ARL Investment Partners, L.P. Dr. Lerner utilizes a research driven approach to determine those factors which lead to sustainable moves in the markets. He has developed many proprietary tools and trading models in his quest to outperform. Over the past four years, Lerner has shared his innovative approach with the readers of RealMoney.com and TheStreet.com as a featured columnist. He has been a regular guest on the Money Man Radio Show, DEX-TV, routinely published in the some of the most widely-read financial publications and has been a marquee speaker at financial seminars around the world.
© 2010 Copyright Guy Lerner - All Rights Reserved
Disclaimer: The above is a matter of opinion provided for general information purposes only and is not intended as investment advice. Information and analysis above are derived from sources and utilising methods believed to be reliable, but we cannot accept responsibility for any losses you may incur as a result of this analysis. Individuals should consult with their personal financial advisors.
Guy Lerner Archive |
© 2005-2022 http://www.MarketOracle.co.uk - The Market Oracle is a FREE Daily Financial Markets Analysis & Forecasting online publication.