


Was S&P 1011 The Stock Market Bottom?
Stock-Markets / Stock Markets 2010 Aug 03, 2010 - 04:29 PM GMTBy: David_Banister

The SP 500 had a very interesting Fibonacci Intersection as I call it here at TheMarketTrendForecast.com on July 1st. At the 1011 pivot low, the index re-traced a Fibonacci 38% of the 2010 highs from the 2009 lows and bottomed out. In addition, the 1011 pivot was a 38% upward re-tracement of the 2007 highs to the 2009 lows. How is it that markets can be considered “random” when in fact they often pivot at clearly defined Fibonacci price points?
Let’s look at the April 2010 highs of 1221 on the same SP 500 index. Did you know that was an exact 61.8% Fibonacci re-tracement of the 2007 highs to the 2009 lows? Were you aware that back in late February 2009, I wrote an article on 321Gold.Com predicting a move to about 1200 on the SP 500, when we were 710 at the time? Did I have a crystal ball or something ephemeral to work with? No, in fact that was an educated guess for a 61% fibonacci rally off a 5 wave decline into March 2009 is all. Even more fascinating is my work showing that at 666, the SP 500 in fact stopped at an exact 61.8% Fibonacci re-tracement of the 1974 lows to the 2000 highs! All of the top and bottom rally points in the past 90 days have been Fibonacci pivots.
The market is certainly not random in our views at TMTF, and we strive to pinpoint tops and bottoms using a combination of Elliott Wave theory and Fibonacci cycles, as well as time periods that often coincide. What is the market doing now after this rally off the July 1st lows? I think the major pivot point to watch is 1131 on the SP 500 and our subscribers know exactly why. Perhaps today you will consider subscribing and avoid wondering what is happening at all these major pivot points? Recent pivots that we outlined were 1011, 1040, 1130, 1121 and more on the SP 500 index for our subscribers.
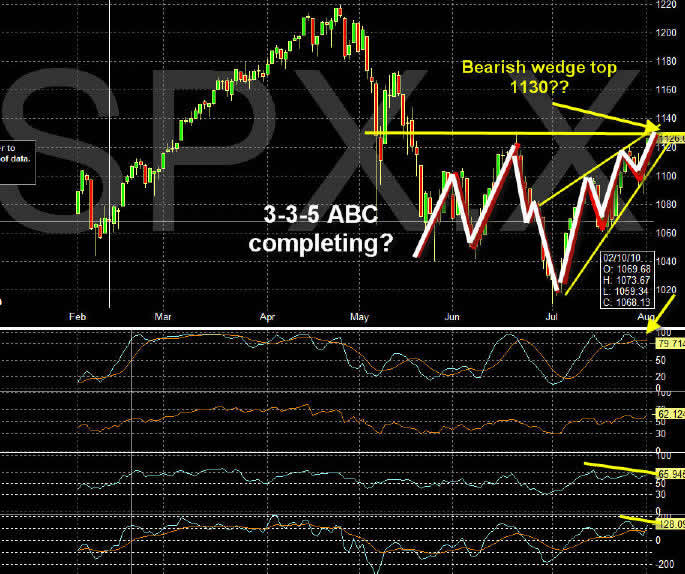
Below I outline a 3-3-5 Elliott Wave Pattern that is often part of a “Corrective Wave” movement. If we can overlay Fibonacci pivots along with reliable patterns, it can help our subscribers avoid pitfalls and take advantage of opportunities in the markets. Gold recently exhibited clear patterns at a late June 2010 top we forecasted. The drop to 1155 was a “rally pivot” we told our readers, and the move up would likely take us as high as $1,212 an ounce before the next major move.
Consider subscribing today and get out of the dark and into the light! If you would like to learn more about our market forecasting service, please go to www.markettrendforecast.com to sign up for free reports and to see what we offer.
Dave Banister
CIO-Founder
Active Trading Partners, LLC
www.ActiveTradingPartners.com
TheMarketTrendForecast.com
Dave Banister is the Chief Investment Strategist and commentator for ActiveTradingPartners.com. David has written numerous market forecast articles on various sites (SafeHaven.Com, 321Gold.com, Gold-Eagle.com, TheStreet.Com etc. ) that have proven to be extremely accurate at major junctures.
© 2010 Copyright Dave Banister- All Rights Reserved
Disclaimer: The above is a matter of opinion provided for general information purposes only and is not intended as investment advice. Information and analysis above are derived from sources and utilising methods believed to be reliable, but we cannot accept responsibility for any losses you may incur as a result of this analysis. Individuals should consult with their personal financial advisors.
© 2005-2022 http://www.MarketOracle.co.uk - The Market Oracle is a FREE Daily Financial Markets Analysis & Forecasting online publication.