


Pattern Analysis of the SP 500 Index Stock Index Rally
Stock-Markets / Stock Index Trading Aug 05, 2010 - 06:59 AM GMTBy: David_Banister
 Judging by some analysts comments, the bullish heads on CNBC, and fearless Bulls, we have to continue to question whether this is a "corrective" rally up in the markets working off oversold indicators and sentiment in late June.... or.... the start of a major 3rd Elliott wave structure off the 2009 bottoms which takes the markets to new all time highs.
In the interim, evidence mounts that the Bull Trade is getting pretty crowded now just 30 odd days since there were nothing but Bears on CNBC and headlines were pretty negative. I scan CNBC here and there mostly to see how many talking heads and pundits are bearish vs. bullish. Near the July 1st lows there were all kinds of calls to raise cash and for markets to move much lower, indicating a bottom was probably nigh. Now nobody is willing to be bearish after this rally, indicating a near term top is nigh as well.
The Elliott Wave patterns still appear to be an intermediate upward correction or a Wave 2 or Wave B up in sentiment off the Jul 1st 1011 SP 500 index lows. Often bottoms come out of nowhere, as do tops. They don't tend to ring bells at either bottoms or tops do they? I don't remember getting a phone call on July 1st, but I did indicate a pivot low around 1008 on the SP 500 would be normal. What I didn't fathom was the extent of the rise since that low, and this has forced be to go back and re-draw charts and find my old Fibonacci calculator.
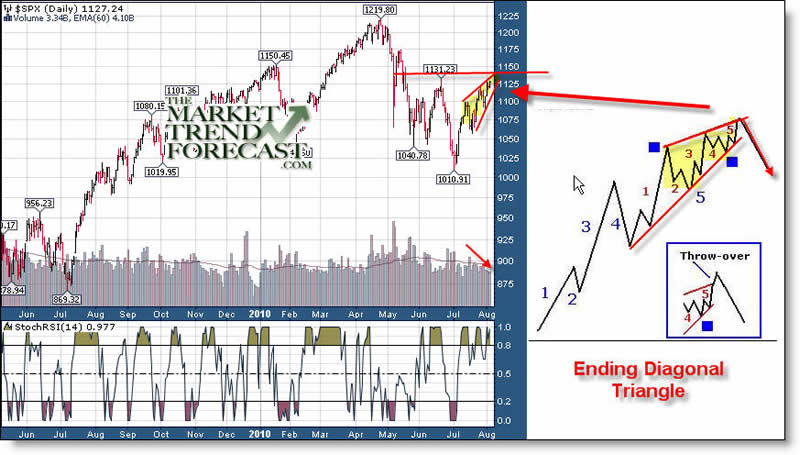
Right now the area between 1131 and 1140 on the SP 500 fits several Fibonacci upward targets over various time zones. In addition, the current pattern looks and walks not like a duck, but like an "Ending Diagonal" triangle. These are terminal patterns and serve to stop sentiment in it's tracks when read right.
Will we have a terminal top or throwover top in the next few days on this rally, then followed by a substantial correction? The probabilities say it’s likely, and below is a chart showing a sample of an "Ending Diagonal" pattern, and then the actual SP 500 pattern right now. They look nearly the same. We will soon see if this "3-3-5" corrective pattern was the right read I made, or if we are off to the races. Evidence suggests a lot of racing from here will be difficult for the Bulls to pull off, but we shall see. The lows at 1011 in terms of the pattern itself, just don't seem that they completed to me, hence my stubborn views that we need a re-test of those lows... time will tell. Sometimes forecasting is like predicting the weather 3 days in advance, we will have to see how the radar is tuned in shortly.
To read more samples of our work please check out www.MarketTrendForecast.com and sign up for free weekly reports.
Dave Banister
CIO-Founder
Active Trading Partners, LLC
www.ActiveTradingPartners.com
TheMarketTrendForecast.com
Dave Banister is the Chief Investment Strategist and commentator for ActiveTradingPartners.com. David has written numerous market forecast articles on various sites (SafeHaven.Com, 321Gold.com, Gold-Eagle.com, TheStreet.Com etc. ) that have proven to be extremely accurate at major junctures.
© 2010 Copyright Dave Banister- All Rights Reserved
Disclaimer: The above is a matter of opinion provided for general information purposes only and is not intended as investment advice. Information and analysis above are derived from sources and utilising methods believed to be reliable, but we cannot accept responsibility for any losses you may incur as a result of this analysis. Individuals should consult with their personal financial advisors.
© 2005-2022 http://www.MarketOracle.co.uk - The Market Oracle is a FREE Daily Financial Markets Analysis & Forecasting online publication.