


Stock Market Indices Close Well Off Lows
Stock-Markets / Stock Markets 2010 Aug 13, 2010 - 03:10 AM GMTBy: Harry_Boxer

 The stock market indices ended lower today, but came way off their lows as a big gap down and early selling thrust ended up being the session lows. They then bounced back in a 5-wave rally that took them right back up to resistance at 1840 on the Nasdaq from a low of 1807 1/2. The S&P 500 snapped back from 1076.70 to 1086.72, about 10 points.
They back and filled, rolled over by midday to retest the early morning pullback lows. That was successful, holding at 1825 NDX and 1080 SPX. They then bounced up to test the early morning rally highs, could not get through, tried it one more time before the close, and then rolled over in the last 15-20 minutes, leaving the indices in the negative column.
Net on the day, the Dow closed about 52 points off its low, down 58.88, cutting the losses in half today at 10,319.95. The S&P 500 closed down 5.86 at 1083.61, about 7 points off its low at the close. The Nasdaq 100 down 13.21 at 1832.17, about 25 points off its low.
Technicals came back, but still managed to close negative by 17 to 13 on the New York Stock Exchange, and by about 3 to 2 on Nasdaq. Up/down volume was a little better than 2 to 1 negative on New York and about the same on Nasdaq. Total volume on New York was under 1 billion at 975 million. Nasdaq, however, traded a heavy 2.14 billion today.
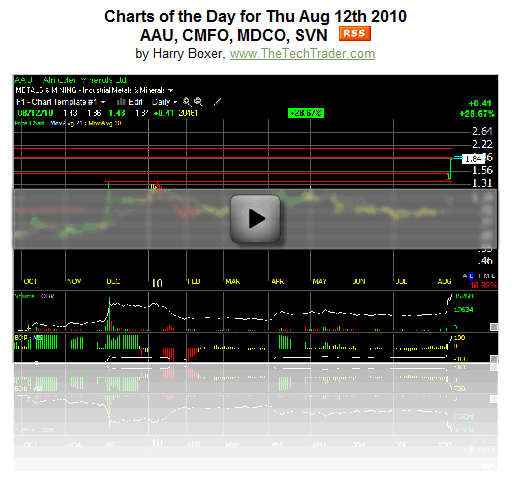
Charts of the Day:
Almaden Minerals Ltd. (AAU) has had quite a terrific price-volume surge recently. You can see on the chart a nice long base followed by a price-volume surge in December 2009, but that settled back down and never did follow through until recently. The Dec, Jan and May highs were exploded through two days ago as the stock gapped up. It pulled back but held the gap, and then today ran 41 cents or 28.67% on more than 2 million shares. That's strong volume for that stock. It closed right near overhead resistance, and there may be some additional resistance ahead us, up around 21/4. My near-term target is right there at that 2.30 range followed by secondary target up around the 3.35 range.
China Marine Food Group Limited (CMFO) as a result of earnings broke out and ran today, up 52 cents or 9 1/2%, trading 854,000 shares. That's the heaviest volume since June, but more importantly, the head-and-shoulders bottom that was formed, and which the price stuck its head above yesterday, was followed through nicely. Current short-term resistance around the 7 1/4 range is set as our short-term target, and then a retest of the Jan high at about 8.65. Long-term, however, looks like this could be a 10 -12 stock.
Medicines Co. (MDCO) had a huge pop on heavy volume earlier this month when it ran from 9 to 15 1/2 in one day. It backed off, but now it's formed a steady rising flag. It looks like a retest of the high may be in order, but I have a secondary target up around 17-17 1/2.
7 Days Group Holdings Limited (SVN) is a newly mentioned stock today, a Chinese hotel-lodging firm that is a fairly recent IPO. Today it broke across the February, May, and early August highs on 516,000 shares, up 1.07 or 8%. This could be foretelling that a quick test is due of the Jan high at 15.25. If it takes that out, then perhaps something around 17 or 18 may be doable.
Reviewing our Watchboard:
TheTechTrader.com board was mostly narrowly mixed. There were a few point-plus gainers and only one point-plus loser. On the upside, one of the stars of the day was a stock we traded, China Agritech Inc. (CAGC), which opened at 14.10, ran to 16.99, and closed up 2.97 at 16.89. A big percentage gain there on 4 1/4 million shares.
Apple Inc. (AAPL) gained 1.62 at 151.79, and closed more than 5 points off its low.
Other fractional gainers of note were Pactiv Corp. (PTV) up 69 cents at 31.14, Cirrus Logic Inc. (CRUS) up 37 cents at 19.03, and China Green Agriculture, Inc. (CGA) 28 cents at 10.69.
Some of the ultra-short ETFs that gained today were Direxion Daily Financial Bear 3X Shares (FAZ) up 28 cents at 15.29, Direxion Daily Small Cap Bear 3X Shares (TZA) 67 cents at 36.42, and the Direxion Daily Large Cap Bear 3X Shares (BGZ) 26 cents at 15.18.
On the downside, Cree Inc. (CREE) lost 1.03 to 58.78. That was the only point-plus loser.
Among fractional losses, Power-One Inc. (PWER) dropped 77 cents to 10.76, Isilon Systems, Inc. (ISLN) 51 cents to 16.83, Acme Packet, Inc. (APKT) 34 cents to 31.10, and ADTRAN Inc. (ADTN) 53 cents to 29.68. Many other stocks that were down today were down just small fractions.
Stepping back and reviewing the hourly chart pattern, the indices were down sharply in the morning, snapped back just as sharply by mid-morning, and then consolidated, going back and forth for the rest of the session, holding support and yet unable to get through resistance.
Tomorrow morning the indices may move sharply one way or the other, which will determine the trend. Short-term oversold conditions may have resulted in a snapback today, but it remains to be seen whether they can extend this beyond key overhead resistance.
Right now we'll be watching 1840 and then 1850 on the NDX. SPX resistance right now is near 1087, and then at 1094. Those are the levels to keep an eye on for tomorrow on the resistance side.
Good Trading!
Harry
For more of Harry Boxer, sign up for a FREE 15-Day Trial to his Real-Time Technical Trading Diary. Or sign up for a Free 30-Day Trial to his Top Charts of the Week service.
(c) 2010 AdviceTrade, Inc. All rights reserved. Distributed only by written permission of AdviceTrade and The Technical Trader at info@advicetrade.com . In using any portion of Harry Boxer's content, you agree to the terms and conditions governing the use of the service as described in our disclaimer at http://www.thetechtrader.com
Mr. Boxer's commentaries and index analysis represent his own opinions and should not be relied upon for purposes of effecting securities transactions or other investing strategies, nor should they be construed as an offer or solicitation of an offer to sell or buy any security. You should not interpret Mr. Boxer's opinions as constituting investment advice. Trades mentioned on the site are hypothetical, not actual, positions.
Harry Boxer Archive |
© 2005-2022 http://www.MarketOracle.co.uk - The Market Oracle is a FREE Daily Financial Markets Analysis & Forecasting online publication.