


The Recent History Of The Future Of Gold
Commodities / Gold and Silver 2010 Aug 15, 2010 - 04:55 PM GMTBy: Henry_Smyth

 As the investment manager of a gold fund, I get a lot of questions these days along the lines of where the gold price is going -- meaning in the immediate future -- and/or how high the gold price will eventually go.
I was discussing this phenomenon with my intern, Zeke Brustkern. Zeke has been working with me now for over a year and just graduated with a BA in Economics from my alma mater, New College in Sarasota, Florida. In the course of his work for me, Zeke developed and maintains all of the graphs used on our website, especially in our quarterly investment management discussion.
In addition, Zeke has been working on building a trading algorithm for the fund to optimize our use of leverage. In the course of his research he has studied a great deal of technical analysis as we spend a considerable amount of time discussing chart formations and various tools within the technical analysis discipline.
Recently, we were looking at a gold chart and discussing price movements and I mused that it seemed most of the charts we looked at employed straight lines whereas the price movement actually looked like a curve. I asked Zeke if he couldn't plot a line through the monthly price points since the current gold uptrend began and see what came up. I also asked him to continue the resulting line into the future to see where it went. A day later, Zeke emailed me the following chart.
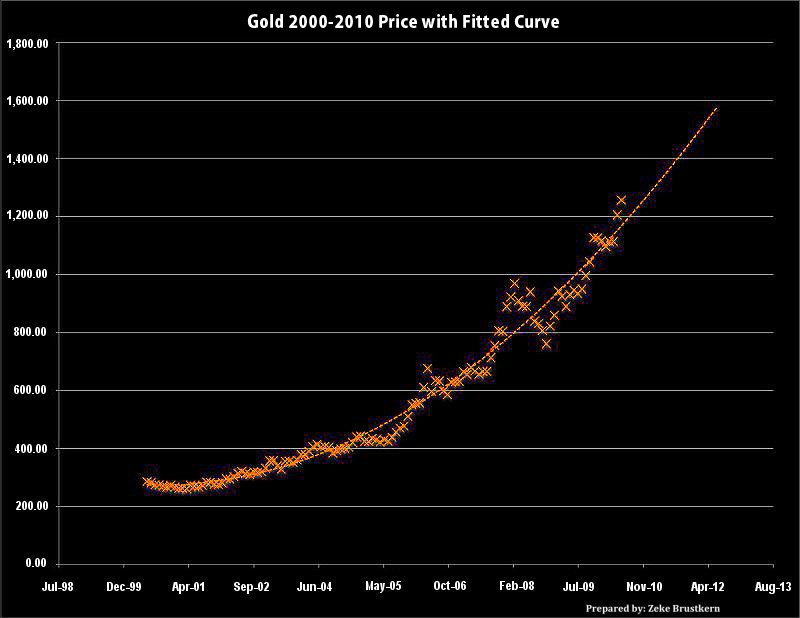
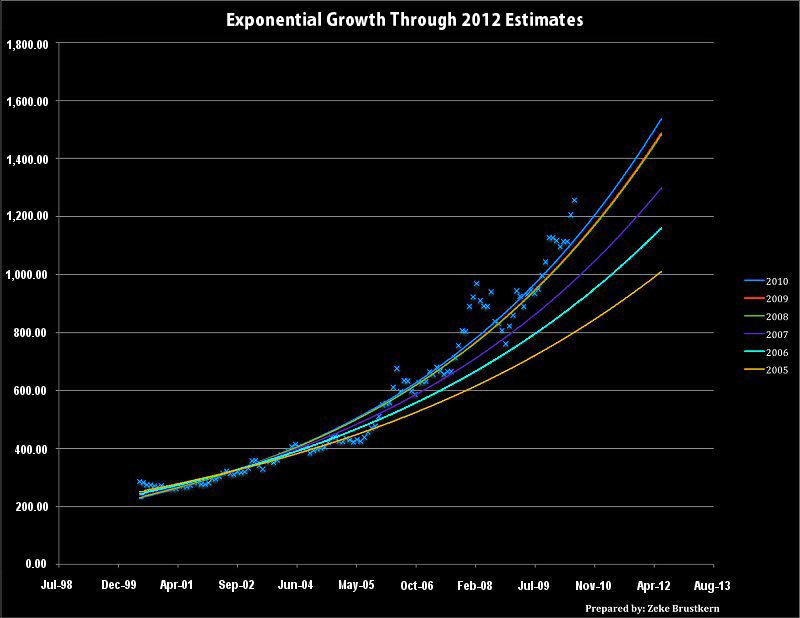
I studied this chart for some time thinking we might be on to something here. I then went back to Zeke and asked if it wouldn't be possible to do the same exercise but for previous time periods beginning from 2000 to 2005 and proceeding to expand the data by one year increments until we came to the present. Two days later, I received the following chart:
I asked Zeke to explain the construction of these charts and this is what he wrote:
| "Plotted above is the monthly gold price as well as the annual projection from June 2010. The data seem to trace the plot of the curve very well, but that's because the curve was designed to be inclusive of the given data. The second chart starts with the projection of a fitted curve to the data available in 2005. Each year since then a new projection is drawn, up until the current June 2010. The over-inflation and subsequent correction during 2008 led to the 2008 projection being very similar to 2009 with the curves overlapping, but in 2010 the positive second derivative returns, and pushes the estimated curve even higher. As it stands, even models designed for high growth have been consistently underestimating the future path of gold. By analyzing the error of each forecast, one can make an educated guess as to what will happen going forward." |
So that is what the charts are, but what do they mean?
The investment thesis behind the Granville Cooper Gold Fund II Ltd. is that gold is in a long term primary uptrend that began around 2000. Such an uptrend is fuelled by a steady flow of net buying pressure from an ever widening pool of investors throughout its evolution. In the case of gold this buying pressure is global and now includes every investment player from central banks to individuals. This buying pressure spans the paper gold markets as well as the physical markets, from the forward, futures and derivatives markets in New York and London to the gold loops, chains and bars sold in the bazaars of Dubai, Mumbai and Shanghai.
What this chart is telling us is that this global buying pressure is increasing with each passing year, and as long as buying pressure is increasing the gold price will continue its uptrend. There is and has been a great deal of commentary on gold at the tactical level but very little at the strategic.
Viewed from a larger perspective what I believe we are seeing is the return of gold to the asset allocation process after an absence of over a generation. This is leading to the return of gold to its historic role as money, as collateral, as the ultimate tender of debt.
Some have called for an official revaluation of gold by central banks to alleviate the strain in the global credit markets. I say gold's revaluation has been underway for ten years through the collective decisions of millions of individuals across every time zone. This will produce profound changes in the geofinancial landscape in ways very few can presently imagine.
Henry Smyth
Director and Investment Manager
http://www.granvillecooper.com
Granville Cooper Asset Management Ltd. (GCAM) is a limited liability corporation under the jurisdiction of the British Virgin Islands. GCAM was organized in 2000 to provide investment advisory services to the Granville Cooper Funds. There are three Directors: Henry Smyth, John Schulz and Sylvio Botto de Barros. The three are also Directors of the Granville Cooper Funds. There were two funds launched in 2000: the Granville Cooper Latin American Fund Ltd. and the Granville Cooper Mexico Fund Ltd. Both funds were based on two Coutts & Co funds managed by Henry Smyth. In 2003, following the redemption of shares by a seed investor, and after a strategic review by the Directors, the funds were reorganized and renamed the Granville Cooper Gold Fund I Ltd. and Granville Cooper Gold Fund II Ltd. A continuous audited net asset valuation was maintained for both funds during this period.
© 2010 Copyright Henry Smyth - All Rights Reserved
Disclaimer: The above is a matter of opinion provided for general information purposes only and is not intended as investment advice. Information and analysis above are derived from sources and utilising methods believed to be reliable, but we cannot accept responsibility for any losses you may incur as a result of this analysis. Individuals should consult with their personal financial advisors.
© 2005-2022 http://www.MarketOracle.co.uk - The Market Oracle is a FREE Daily Financial Markets Analysis & Forecasting online publication.