


SP500 and Gold Forecast Follow-Up
Stock-Markets / Financial Markets 2010 Aug 19, 2010 - 04:15 PM GMTBy: David_Banister

In my last article a few weeks ago for Kitco.com, I was concerned that the market could have a hangover after the recent rally. Apparently, my concern was not un-founded as we dropped from a rising bearish wedge near 1130, to the 1070 Fibonacci pivot earlier this week. Although my subscribers were prepared for this drop by shorting the SP 500 in advance of that move, we covered our short near 1070 on the SP this week.
Bringing things up to speed, the market rallied up from July 1st to near 1130, which was a maximum target I mentioned in my last article. This completed a 3-3-5 elliott wave pattern that I identified, and broke the rising wedge on cue. At 1130, the SP 500 had re-traced a Fibonacci 61% of the April highs to Jul 1st lows, and had completed that re-tracement over a Fibonacci 5 week window. At TMTF, we believe that markets move in extremely reliable patterns and are not at all random. At the 1221 SP 500 top in April, it landed exactly at a 61% Fibonacci upward re-tracement of the 2007 highs and the 2009 lows. At the 2009 lows, the SP 500 had corrected 61% of the 1974 lows to 2000 highs right on the nose at 666!
What I forecast now is for a re-test of the 1011 area on the SP 500 to be completed likely by the end of August, and potentially a drop to 942 by the end of September and early October. I realize this is not a popular forecast right now, but at a bare minimum we should expect the market to go back and bounce off the 1011 area where it bottomed on July 1st. What would negate this view is if the SP 500 can rally past 1105 this week and hold into next week, then we may expect the bulls to re-take control. Another interesting point is when the market did in fact bottom at 1011, it was a Fibonacci Intersection. By that I mean it re-traced 38% of the 2009 lows to 2010 highs, and also was at the exact 38% pivot of the 2007 highs to 2009 lows at the same time. This gives pretty strong support for a 2010 market bottom, with the re-test possible.
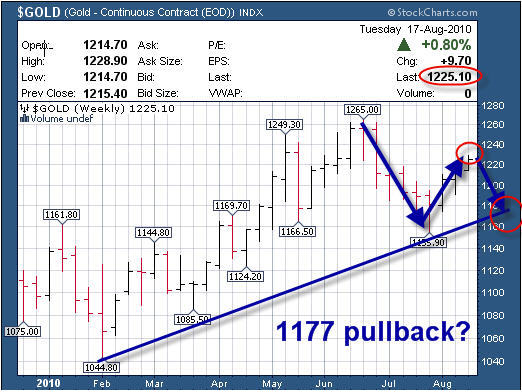
I expect Gold to complete it’s “B wave” bounce at 1225-1238 ranges, and pull back to re-test the $1,155 recent low, but possibly stopping around $1177. That recent pivot low was a 50% Fibonacci re-tracement of the February lows and June highs of this year. Again, markets actually move in reliable patterns as they are largely controlled by the crowd’s sentimental reactions to news and events, which tend to be the same over time no matter the conditions. The downside to Gold is that we have had 8 consecutive years of Gold ending the calendar year in positive territory, and somewhere along the line that trend is likely to be interrupted. The lower level projections I have for gold are a deeper re-tracement to as low as $1,040 by the end of this year, correcting a recent 21 Fibonacci month advance. The probabilities as outlined on my chart below are for $1,177, a 38% Fibonacci figure.
If you would like to sample our work for free, go to www.markettrendforecast.com and sign up.
Dave Banister
CIO-Founder
Active Trading Partners, LLC
www.ActiveTradingPartners.com
TheMarketTrendForecast.com
Dave Banister is the Chief Investment Strategist and commentator for ActiveTradingPartners.com. David has written numerous market forecast articles on various sites (SafeHaven.Com, 321Gold.com, Gold-Eagle.com, TheStreet.Com etc. ) that have proven to be extremely accurate at major junctures.
© 2010 Copyright Dave Banister- All Rights Reserved
Disclaimer: The above is a matter of opinion provided for general information purposes only and is not intended as investment advice. Information and analysis above are derived from sources and utilising methods believed to be reliable, but we cannot accept responsibility for any losses you may incur as a result of this analysis. Individuals should consult with their personal financial advisors.
© 2005-2022 http://www.MarketOracle.co.uk - The Market Oracle is a FREE Daily Financial Markets Analysis & Forecasting online publication.