


Investor Shift from U.S. Treasury Bonds and into Gold and Commodities?
Interest-Rates / US Bonds Sep 08, 2010 - 09:07 AM GMTBy: Gary_Dorsch

 For the past decade, prices in Japan have been stable or fallen, in an economy where the central bank has pegged its overnight loan rate near zero-percent, and where 10-year bond yields haven’t climbed above 2-percent. Between 1991 and 1995, Tokyo spent $2.1-trillion on public works, in an economy that’s less than half the size of the United States, in order to lift its economy out of a severe downturn caused by the bursting of a real estate and stock market bubble in the early 1990’s.
By 1996, Japan’s economy started to rebound, growing at a +3% clip, but it was stymied by premature spending cuts and tax increases, due to concerns about ballooning budget deficits. In total, Japan spent $6.3-trillion on construction-related public investment between 1991 and September 2008. But while spending remained high, Japan never escaped its recurring bouts with deflation and recessions. Instead, Japan accumulated the largest public debt in the developed world, equaling 180% of its $5.5-trillion economy, - while failing to generate a sustainable recovery.
The size of America’s $820-billion stimulus plan is far less than what Japan spent, and now that various programs are being phased-out, traders in the G-7 bond markets have begun to fear that the US-economy could stumble into a “double-dip” recession, leading to a Japanese style deflationary trap. As of May, Japan’s year-over-year core deflation rate stood at -1.6%, and in August, its 10-year government bond yield briefly slipped below 1%, for the first time in seven-years.
If deflationary psychology takes hold among consumers, they’ll wait for still lower prices, before buying, adding to the deflationary spiral. And as Japan’s experience suggests, deflation can increase the financial pain of a traditional recession. When deflation strikes, lower sales prices cut into business profits and in turn, prompts companies to trim payrolls. That undermines consumers’ buying power, leading to a vicious cycle of more pressure on profits, jobs, and wages, - and cutbacks in purchases of new equipment. Likewise, bond yields can stay unbelievably low.
The Fed has vowed not to make the same mistake as the Bank of Japan, which waited too long to ease its monetary policy in the early 1990’s. Taking note of Japan’s experience, the Fed pledged in March 2009, to buy $1.45-trillion of mortgage securities backed by Fannie Mae and Freddie Mac, and $300-billion of long-term Treasury bonds. During the Great Depression, the Fed allowed the money supply to fall rapidly, and consumer prices fell 10% between 1929 and 1933.
On Sept 1st, Philadelphia Fed chief Charles Plosser said he would be open to further bond purchases if he saw deflation as a real risk. “I would certainly entertain the solution if I feared deflation, and if expectations were coming unglued in that direction. Then we would have to take actions,” he warned. Treasury bond traders should be careful for what they wish for. Soon after the Fed launched QE-1 in March 2009, the US-Treasury’s 10-year yield turned sharply higher, climbing from 2.60%, to as high as the impenetrable 4-percent level, just two months later.
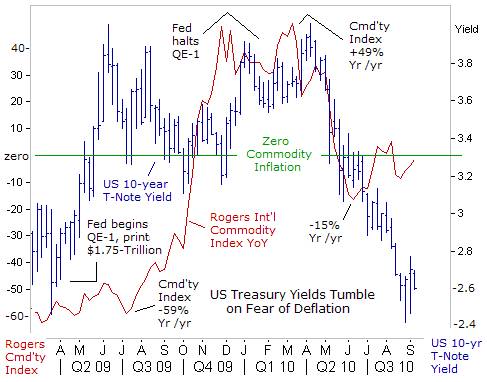 Unleashing QE-1 ignited fears in the T-bond market of “too-much” money chasing “too-few” goods, that would unleash good, old-fashioned, – Inflation, - the magic elixir for debtors, but injurious for lenders. Sure enough, following a time lag of about four-months, the Rogers International Commodity Index, (RICI), containing a basket of 36-commodities, began to surge sharply higher on a year-over year basis, climbing from a reading of -54% in July 2009, to as high as +37% in Q’1, 2010.
The upward surge in global commodity inflation and Treasury bond yields converged in Q’1, 2010. The RICI peaked at +49%, while the ten-year T-note yield peaked at 4-percent. At about the same time, the Fed was winding down QE-1, buying its last batch of MBS’s in March 2010. Since then, shockwaves from the Greek debt crisis, and a stoppage of the Fed’s money injections, helped trigger a sharp downturn in Treasury yields, and also knocked the commodity inflation into negative territory.
For all the smug confidence about a sustainable economic recovery this year, sentiment turned upside down by August. The flavor of the month shifted 180-degrees to talk about a “double-dip” US-recession and a slide into a Japanese style deflationary trap. As Mark Twain used to say, “It ain’t what you don’t know that gets you into trouble. It’s what you know for sure that just ain’t so.”
When it comes to judging the true rate of inflation, an investor can choose to rely on government statistics, which are often fudged by apparatchiks, for political purposes, or an investor can observe the dollars and cents that move the commodities market, for real-time clues about the future direction of inflation or deflation. Using this simple rule of thumb, the RICI is now trading near a zero rate of inflation, signaling that the bond market’s fear of a deflationary trap is overblown.
 In Japan, the central bank and the ministry of finance (MoF) manhandled the JGB’s 10-year yield within a narrow range between 1% and 2%, for the past seven years. Massive overdoses of liquidity injections over the years have left the $8.5-trillion JGB market dysfunctional. Still, it was of great interest, when 10-year JGB yields briefly slipped below the psychological 1%-level, in late August.
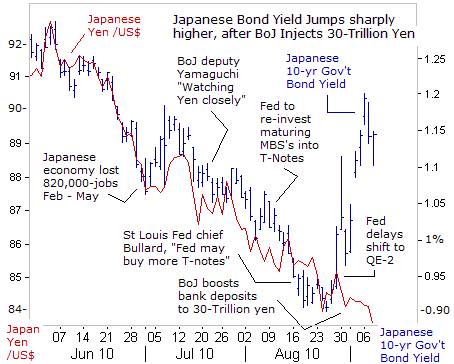
The historic slide in Japanese bond yields mirrored the US-dollar’s slide to a 15-year low against the Japanese yen. Every time the US-dollar falls by 1-yen, it reduces Japanese exporter profits by about 0.90%, and weakens the Nikkei-225 index. The yen has risen 11% against the dollar so far this year, driven by safety-seeking flows lately on fears the US-economy may be sliding into a “double-dip” recession, and worries that Greece might ask for a restructuring of its debts.
Yields on Japan’s 30-year bonds briefly fell below the 20-year yield, - projecting a flat yield curve, and sliding to the fault line of a highly dangerous inverted curve. “Currency rates have come to a critical juncture,” warned Japan’s deputy banking chief Kohei Otsuka on August 11th. “A rapid yen rise would boost deflationary factors, so the government and BOJ must act as one in considering our commitment to act against deflation,” he said. On August 27th, Japan’s Prime-minister Kan vowed to take strong measures to stop the dollar’s slide against the yen.
On August 30th, the BOJ tried to stop the US-dollar’s slide, by boosting its deposits in the local banking system to 30-trillion yen ($350-billion), up from 20-trillion yen previously. Increasing the supply of yen briefly boosted the US-dollar to as high as 86-yen. The Fed’s decision to delay QE-2 for awhile longer, also gave the US-dollar some respite from bearish currency speculators. However, the intervention effort fizzled, and within a few days, the US-dollar tumbled to 83.50-yen. On Sept 7th, Japanese Finance chief Yoshihiko Noda said Tokyo would take decisive steps to cap the yen’s rise, including intervening in the FX market to weaken the yen.
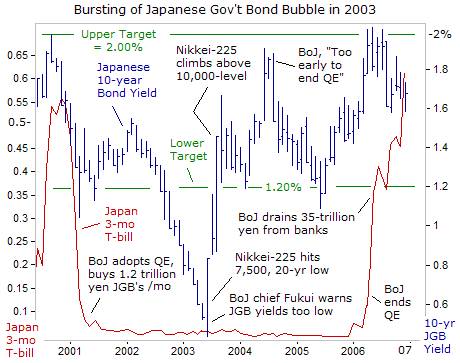 Ironically, the biggest reaction to the BoJ’s injection of an extra 10-trillion yen, was in the JGB market, where ten-year yields boomeranged, and spiked upwards to as high as 1.20%, marking a 30-basis point jump from a low of 0.90% hit in late August. Traders have long memories of the bursting of the JGB bubble in the second half of 2003, that saw yields ratchet upwards from a record low of 0.53% to as high as 1.65% within four-months. Already, investors who locked-in JGB 10-year yields below 1% last month, have suffered a 2% capital loss over the past few days.
Trying to push ultra-low JGB yields even lower is like trying to push a helium balloon under water. In order for JGB 10-year yields to stay below 1%, the deflation rate in Japan must average a negative 2-percent. There is an absolute limit to how far long-term bond yields can fall, and with the BoJ’s overnight loan rate pegged at 0.10%, the probability of an inverted yield curve is near zero-percent. Only foreigners can still make money in JGB’s if the yen continues to climb higher the Euro and US-dollar. But the yen’s potential gains from here would be much tougher, if Tokyo’s financial warlords are prepared to engage in full-scale battle.
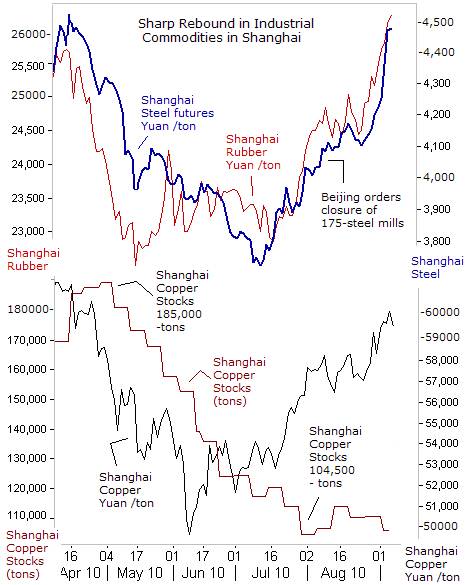 Fears of “double-dip” recessions in Japan and the US couldn’t dent summer rallies in key industrial commodities, such as copper, rubber, and steel - traded on the Shanghai Futures Exchange. In each case, the rallies were supported by a reduction in supply. Orders by Beijing to Chinese steel mills to trim output by 25-million tons annually prompted a rally in steel prices across Asia. That equals 4% of China’s record crude steel output, and a quarter of the nation’s excess supply.
China, the world’s largest natural rubber user, is expected to boost imports 10% this year after “robust demand” from tire makers depleted inventories to the lowest level in seven-years. Natural rubber prices climbed to 26,200-yuan ($3,850) /ton on the Shanghai exchange, the highest level since July 2008. Rubber stockpiles tracked by the Shanghai Futures Exchange declined to 14,770-tons on June 24, the lowest since Feb 2003, and fell sharply from 24,700-tons last week.
About half of the world’s rubber supply is used for making tires. China’s tire exports jumped 30% in the first six months from a year earlier to 87-million tires as demand from developing countries outweighed lost sales in the US, which levied a 35% tariff on China-made tires. Total vehicle sales in China were 56% higher compared with a year ago to 1.22-million units, boosting the demand for rubber.
Copper futures in Shanghai rebounded 20% over the past ten-weeks, tracking gains on the Shanghai red-chip index. Global copper miners put a floor under the London copper market at $6,000 /ton, by cutting output 6% in the first half of this year. Copper stockpiles held at the London Metal Exchange were whittled down to 395,000-tons, down 28% since mid-February levels of 555,000-tons. In Shanghai, copper stocks dropped to 105,200-tons today, from 185,000-tons in April.
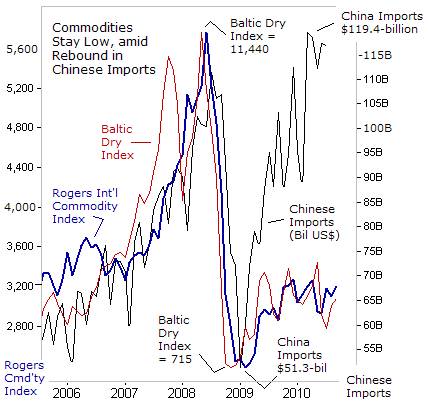 Still, when viewed from a longer-term perspective, the Rogers Int’l Commodity Index, and the Baltic Dry Index, are far below their bubble highs of 2008, and little changed from levels that prevailed 5-years ago. Chinese imports, a key driver of the “Commodity Super Cycle” in earlier years, rebounded to new all-time highs, yet the commodity indexes were left behind in the dust. China is taking advantage of the lower commodity prices, by restocking iron ore, coal, crude oil, and soybeans, from Australia, South Africa and South America, as it braces for the winter season, with droughts and floods across the globe causing a shortage of grains.
The US-government aims to keep inflation under wraps through greater regulation of commodity traders, in the event the Fed decides to unleash QE-2, and boosts the money supply. The CFTC began eyeing position limits after oil and other commodity prices soared to record highs in 2008, on signs that investment banking firms were dominating trade. The commodities market was valued at $2.9-trillion in December 2009, and US-investment banks held one-third of the contracts.
Wall Street Oligarchs, JP-Morgan Chase and Goldman Sachs, are closing their proprietary trading operations in commodities, in conformity with financial reform, after more than five-years of rapid expansion. Yet other legions of commodity speculators are entering the game, and in recent weeks, commodities such as oil, copper, cotton, grains, and gold had strong trading volume. Chinese and Indian demand for commodities is also expected to grow in the years ahead.
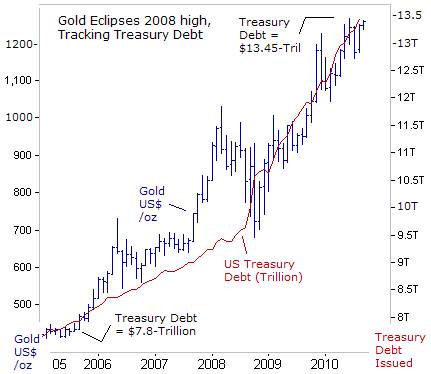 Interestingly enough, while fixed-income speculators are touting the illusion of a deflationary trap, the price of Gold is climbing to new all-time highs, hitting $1,260 /oz this week. The gold market is thriving in a world of ultra-low interest rates, and is squarely focused on the burgeoning size of the US-Treasury’s outstanding debt. On August 19th, the non-partisan Congressional Budget Office (CBO) forecast the US-budget deficit will hit $1.34-trillion this fiscal year ending Sept 31st.
CBO also predicted the budget deficit for fiscal year 2011, which begins on Oct 1st, would reach $1.15-triilion, bringing the Treasury’s debt to a record $14.55-trillion, and greater than 100% of the nation’s GDP. As a general rule of thumb, the price of gold climbs about $140- /oz for every $1-trillion increase in the amount of US-red ink. If correct, Gold could reach $1,400 /oz over the next 12-months, and could exceed this bullish forecast, if the Fed unleashes QE-2, as is widely expected.
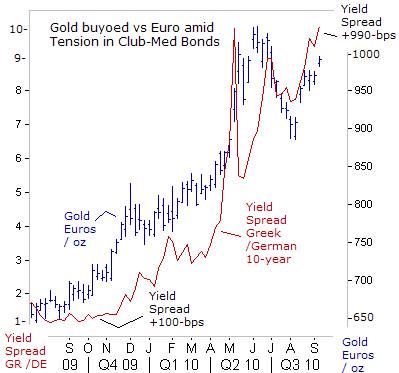 In Europe, the gold market is buoyed by widening yield spreads between 10-year German bond yields and those of Irish and Portuguese debt, which climbed to all-time highs this week, while the German-Greek yield spread increased to +990-basis points, exceeding the May 7th high. A Wall Street Journal report said its analysis showed bank stress tests published in July had understated some European banks’ holdings of risky government debt. The Irish/German 10-year government bond yield spread hit a lifetime high of +390-bps, or 40-bps wider on the day. The equivalent Portuguese yield spread hit its widest since May 10th at +360-bps.
The deepening crisis in Greece has resulted in near-record levels of unemployment. Official unemployment now stands at 12%, but hardest hit are younger workers, with 32.5% of all workers between 15-years and 24-years unemployed in May. Euro-zone bond traders are worried that Athens will eventually seek a restructuring, which could mean a 50% haircut for its lenders. Banks’ worldwide exposure to Greek debt in the first quarter of the year was $297-billion. The IMF foresees Greece’s debt topping out 150% of gross domestic product in 2012.
 The amount of money flowing into US-bond funds is poised to exceed the cash that went into stock funds during the internet bubble, stoking concern that fixed-income markets are ripe for profit-taking. Investors poured $480-billion into mutual funds that focus on debt in the two years ending June, compared with the $497-billion received by equity funds from 1999 to 2000. American banks plowed $500-billion into Treasury bonds - stealth monetization of the government’s debt.
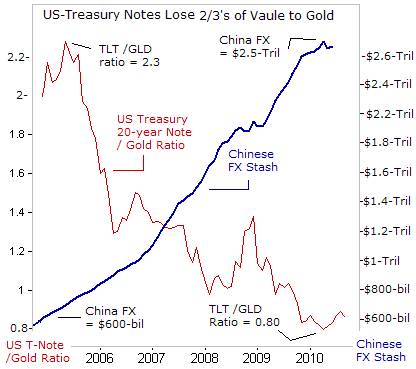
A widespread exodus of baby-boomers from the equity market is behind the mania. However, investors should consider that during the past six-years, long-term US-Treasury notes have lost two-thirds of their relative market value, when compared to hard-money, - Gold. Beijing has made a tragic mistake, by investing two-thirds of $2.5-trillion FX stash into US-bonds. Trying to figure out how Beijing and other central banks, will invest their FX-stash in the months ahead, is the topic of the Sept 8th edition of the Global Money Trends newsletter.
This article is just the Tip of the Iceberg of what’s available in the Global Money Trends newsletter. Subscribe to the Global Money Trends newsletter, for insightful analysis and predictions of (1) top stock markets around the world, (2) Commodities such as crude oil, copper, gold, silver, and grains, (3) Foreign currencies (4) Libor interest rates and global bond markets (5) Central banker "Jawboning" and Intervention techniques that move markets.
By Gary Dorsch,
Editor, Global Money Trends newsletter
http://www.sirchartsalot.com
GMT filters important news and information into (1) bullet-point, easy to understand analysis, (2) featuring "Inter-Market Technical Analysis" that visually displays the dynamic inter-relationships between foreign currencies, commodities, interest rates and the stock markets from a dozen key countries around the world. Also included are (3) charts of key economic statistics of foreign countries that move markets.
Subscribers can also listen to bi-weekly Audio Broadcasts, with the latest news on global markets, and view our updated model portfolio 2008. To order a subscription to Global Money Trends, click on the hyperlink below, http://www.sirchartsalot.com/newsletters.php or call toll free to order, Sunday thru Thursday, 8 am to 9 pm EST, and on Friday 8 am to 5 pm, at 866-553-1007. Outside the call 561-367-1007.
Mr Dorsch worked on the trading floor of the Chicago Mercantile Exchange for nine years as the chief Financial Futures Analyst for three clearing firms, Oppenheimer Rouse Futures Inc, GH Miller and Company, and a commodity fund at the LNS Financial Group.
As a transactional broker for Charles Schwab's Global Investment Services department, Mr Dorsch handled thousands of customer trades in 45 stock exchanges around the world, including Australia, Canada, Japan, Hong Kong, the Euro zone, London, Toronto, South Africa, Mexico, and New Zealand, and Canadian oil trusts, ADR's and Exchange Traded Funds.
He wrote a weekly newsletter from 2000 thru September 2005 called, "Foreign Currency Trends" for Charles Schwab's Global Investment department, featuring inter-market technical analysis, to understand the dynamic inter-relationships between the foreign exchange, global bond and stock markets, and key industrial commodities.
Copyright © 2005-2010 SirChartsAlot, Inc. All rights reserved.
Disclaimer: SirChartsAlot.com's analysis and insights are based upon data gathered by it from various sources believed to be reliable, complete and accurate. However, no guarantee is made by SirChartsAlot.com as to the reliability, completeness and accuracy of the data so analyzed. SirChartsAlot.com is in the business of gathering information, analyzing it and disseminating the analysis for informational and educational purposes only. SirChartsAlot.com attempts to analyze trends, not make recommendations. All statements and expressions are the opinion of SirChartsAlot.com and are not meant to be investment advice or solicitation or recommendation to establish market positions. Our opinions are subject to change without notice. SirChartsAlot.com strongly advises readers to conduct thorough research relevant to decisions and verify facts from various independent sources.
Gary Dorsch Archive |
© 2005-2022 http://www.MarketOracle.co.uk - The Market Oracle is a FREE Daily Financial Markets Analysis & Forecasting online publication.