


US Economy Sliding towards Stagflation - Global Bond Vigilantes Hooked on Gold
Economics / US Economy Oct 03, 2007 - 01:56 PM GMTBy: Gary_Dorsch

 Nowadays, traders of all different stripes are betting on more rate cuts by the Federal Reserve in the months ahead. Since mid-July, the odds of a US economic recession have been mounting, led by sliding home prices and the first loss of US jobs in four years in August. Sales of new single-family homes fell 8.3% in August to a 795,000 annual sales pace, to stand 21.3% lower from a year ago, and the glut of unsold existing US homes has swelled to the highest in 18-years.
Robert Shiller, a Yale university economist, told a US Congressional panel on Sept 19th, “The collapse of US home prices might turn out to be the most severe since the Great Depression. The decline in house prices stand to create future dislocations, like the credit crisis we have just seen.” According to the S&P/Case Shiller national home price index, US home prices in the top-20 metropolitan areas fell 0.4% in July from June, to stand 3.9% lower from a year earlier.
Former Fed chief “Easy” Al Greenspan said on Sept 16th, the he would not be surprised if US home prices fell by double-digits into 2008. A fall in home prices on that scale would be unprecedented in US history. US residential real estate has an aggregate value of about $21 trillion, and is the single biggest source of US household wealth. If home prices fall roughly 15%, it could wipe out $3 trillion of household wealth, and deal a huge blow to consumer spending.
A double-digit decline in US home prices could also spark big job losses. Construction employment fell about 15% in both the 1990's and 1980's recessions, and it dropped 18% in the recession of the mid-1970's. In each case, the sector's declines were far steeper than job losses in the overall economy, and the recovery took longer. About 7.6 million Americans workers are employed by construction companies, so a 15% decline would translate into the loss of 1 million jobs.
According to ADP Employer Services, employment in the construction sector fell by 20,000 in September, the 12th decline in thirteen months, bringing the total decline since August of 2006 to 157,000 workers. The US Labor department appears to be vastly overstating the level of employment in the construction sector, which is far out of alignment with the 44% plunge in US building permits from two years ago.
It's not just the prospect of a sharp decline in US homes prices which has the Bernanke Fed in a state of panic. About 5 million adjustable-rate mortgages are slated to reset to higher rates in the next 18-months. Therefore, the housing slump could deepen if the Fed doesn't lower short-term rates, to ease the plight of homeowners who are unable to refinance loans under tighter underwriting guidelines and as home values stagnate or fall.
US Treasury Traders bet on more Fed rate cuts
Historically, the US economy has gone into recession seven times since 1960, and six of the downturns were foreshadowed by an Inverted yield curve, when yields on three-month Treasury bills are higher than for ten-year Treasury Notes. Usually, when lenders in the bond market are willing to accept lower interest rates for longer term debt than for shorter term debt, it is a signal that the US economy is about to experience a serious slowdown or even a recession within 12-months.
So far in this decade, the Inverted yield curve has made two grand appearances. Between March and Dec 2000, at the height of the frenzy for internet and high tech stocks, the yield curve was inverted, but stock market bulls argued that its shape reflected the Clinton administration's retirement of longer term debt from huge budget surpluses. But the Nasdaq and S&P 500 did begin to implode in 2001, and an eight month economic recession arrived in 2002.
More recently, the yield curve inverted between February 2006 and June 2007. At its peak in February 2007, the yield on the US three-month T-bill rate was roughly 60 basis points above the benchmark 10-year yield. At that time, many analysts predicted the inversion would at least signal slower economic growth, but few were convinced it would spell a contraction of gross domestic product for two consecutive quarters, the typical definition of recession. The yield curve's only wrong signal was in 1966, when the curve inverted but no recession followed.
Nowadays, the US home prices are tumbling and threatening to drag the US economy into recession in 2008. According to former Fed chief “Easy” Al Greenspan, “The critical variable is the price of homes in the United States. I would expect home price declines to continue until the rate of inventory liquidation reaches its peak. And a weakened US consumer market, still has the capacity to impact our trading partners,” Greenspan told a gathering of reporters in London on October 1st
During the three previous Fed easing campaigns, whenever the two-year Treasury yield fell to more than -50 basis points below the fed funds target, the Fed lowered its target rate each period. In August 2007, the 2-year T-Note yield fell to -110 basis points below the 3-month T-bill rate, persuading the Fed to slash the fed funds rate by a larger-than-expected 50 bp on Sept 18th. The longer the spread between the two-year T-Note yield and the fed funds rate stays below -50 basis points, the greater the likelihood of more Fed rate cuts in the months ahead.
US Economy caught in “Stagflation” Trap?
Finally forced to choose between defending US home prices or the US dollar, the Bernanke Fed decided to sacrifice the greenback, and slashed the fed funds rate by 50 basis points to 4.75% on Sept 18th. “We took the action to try to get out ahead of the situation and try to forestall potential effects of tighter credit conditions on the broader economy. The resulting global financial losses have far exceeded even the most pessimistic estimates of the credit losses on these loans,” Fed chief Ben Bernanke explained on Sept 20th.
But unlike previous US economic slowdowns which have worked to contain inflationary pressures in the global commodity markets, this time around, the Fed's aggressive rate cut on Sept 18th, ignited big rallies in a broad spectrum of commodities to all-time highs, and lifted gold to a 28-year high. Greenspan warned the Bernanke Fed to be careful, and not cut rates too aggressively, “because the risk of an inflationary resurgence is greater now than when I was chairman,” he told the Financial Times on Sept 16th, two days before the Fed rate cut.
But Bernanke ignored his mentor's advice, and shocked the world markets on Sept 18th, by slashing the fed funds rate a larger-than-expected half-point to 4.75%. That allowed the inflation genie to escape from its bottle. The Fed's latest rate cut lifted the benchmark DJ AIG Commodity Index from a -3% year over year loss in August to positive +11.6% gain in September.
Meanwhile, the Fed's aggressive rate cut conveyed a sense of panic, and wasn't copied by any other central bank, thus knocking the US dollar to 15-year lows. In turn, a weaker US dollar is engraving sharply higher food and energy prices into “core” inflation. Corn futures gained 9.7% last month, and soybean futures climbed 14% in September, up 79% in the past year, after US farmers cut acreage 15% to a 12-year low. Wheat futures were up 21% for September towards $10 /bushel, the sixth straight monthly gain. Milk futures are up 70% from a year ago.
Crude oil prices rose 16% last quarter, the biggest quarterly percentage gain since the first quarter of 2005. In US dollars, West Texas Intermediate is up 30% in the past year. Oil is up 16% in euros, 19% in British pounds and 26% in yen.
“We're beginning to see the extraordinary period of disinflation and economic growth coming to a halt,” Mr Greenspan told a business audience in London on October 2nd. “We now have to be very sensitive to the fact that inflationary pressures could well get out of hand. The trade-off between inflation and growth had become more negative,” Greenspan warned. Thus, in trying to stave off a recession with aggressive rate cuts, the Bernanke Fed might still end up with the worst of all possibilities, a stagnant economy and rising inflation, or “Stagflation”.
Fed Officials Engage in Intellectual dishonesty,
Greenspan said that Mr Bernanke would have a tougher job than he did in dealing with the trade off between growth and inflation. But Mr Bernanke appears to have already geared US money policy towards fighting a housing led recession at the expense of much higher inflation. Since Bernanke became Fed chief in March 2006, the growth rate of the US M3 money supply has exploded to a 14% annualized clip, its fastest rate in 35-years, sending gold to $750 /oz, it's highest in 28-years.
Bernanke was asked about the importance of the US money supply on July 10th, “The monetary aggregates do not have a special role in the formulation of US monetary policy. Our experience has been that financial innovation and other factors have tended to create a relatively weak relationship in the short run between money and inflation and money and output,” he said.
Not surprisingly on Sept 11th, the Fed's newest rookie Frederic Mishkin remarked that, “Gold is not a particularly reliable indicator of inflation,” downplaying the yellow metal's 15% jump in Q'3, its best quarterly performance since 1999. Instead, Mishkin was declaring victory in the war against inflation on Sept 27th. ”Inflation has come down in the old-fashioned way. Tighter monetary policy and a commitment to price stability by central banks throughout the world have led to lower inflation and an anchoring of inflation expectations,” Mishkin said.
On July 10th, Bernanke appeared to firmly endorse the Fed's long-standing practice of focusing more heavily on core price measures in setting monetary policy. “Inflation is less responsive than it used to be to changes in oil prices and other supply shocks. If inflation expectations are well anchored, changes in energy and food prices should have relatively little influence on core inflation,” he argued.
While Fed officials point to inflation statistics that are conjured up by government apparatchniks, traders should focus their attention on the global commodity markets for real time indications on inflation expectations. And it's not just the prices of food, energy, and gold that are hitting historical highs these days. The cost of shipping dry goods around the world is soaring to stratospheric heights.
The Baltic Dry Freight Index is a barometer of the volume of global trade, and it hit an all-time highs of 9,474, up sharply from the 4,000-level a year ago. And unlike stock and commodity markets, the Baltic Dry Index does not contain speculative froth. The booming Chinese and Indian economies are key drivers for the Baltic Dry Index. Does the parabolic rise of the BDI to 9,500 represent a Nasdaq-style bubble or rather an Asian demand-led structural change?
Global Bond Vigilantes hooked on Gold
With booming commodity and stock markets detected in all corners of the earth, and out of control money supply fueling inflation, the global bond vigilantes should be reacting by jacking up long term interest rates. Instead, global bond yields have tumbled by anywhere from 50 to 75 basis points since mid-July, when revelations of the sub-prime debt crisis surfaced.
While the US economy is sliding towards “Stagflation”, other economies in Australia, Brazil, Hong Kong, India, Japan, Russia, and South Korea are de-coupling away from the US locomotive, and have become more “China-centric,” feeding on the world's fastest growing economy, which is booming ahead at a 12% clip. Therefore, Fed rate cuts are simply adding more firepower to the “Commodity Super Cycle” which is increasingly fueled by a strong global economy, and not just the US economy.
In the $11 trillion Euro zone economy, there are recent signs of a economic slowdown, but higher raw material prices are exerting upward pressure on inflation. On Sept 15th, Austrian central bank chief Klaus Liebscher warned that sharply higher oil prices, were a big inflation risk which the ECB had to keep a close eye on. “Upside risks are prevailing with respect to inflation, oil prices, basic foodstuffs that are getting more expensive, higher wages driven by the good economic situation” Liebscher told the Der Standard newspaper.
Euro zone inflation rebounded to +2.1% in September against +1.7% in August, rising above the European Central Bank's target for the first time in a year. The Euro M3 money supply is 11.6% higher from a year ago, which ignited a gold rally from 485 euros on August 27th to as high as 528 euros /oz this week. Gold jumped above the psychological 500 euro /oz level, after the ECB admitted its hands were tied by the Bernanke Fed, and left its repo rate unchanged at 4.00% on Sept 6th.
Any attempt by the ECB to tame the explosive growth of the Euro M3 money supply by lifting its repo rate to 4.25%, could catapult the Euro to $1.500, especially if the Bernanke Fed is lowering the fed funds rate at the same time. On October 3rd, Italian Prime Minister Romano Prodi spoke with German Chancellor Angela Merkel about the strong Euro, “There is concern that the US monetary policy is very attentive exclusively towards domestic interests,” Prodi said.
“Having crossed $1.40 against the US dollar and appreciating against the Chinese yuan and Japanese yen, the Euro exchange rate has attained a pain threshold for European companies,” said BusinessEurope President Ernest-Antoine Seilliere on October 3rd. Yet any attempt by the ECB to lower its repo rate to curb the strength of the Euro could stimulate faster money supply growth and inflationary pressures.
In today's bond markets, which are plagued by heavy intervention from central banks, it might not be possible for the bond vigilantes of yesteryear to swing the big stick and jack-up bond yields to punitive levels. Instead, bond vigilantes must operate via the gold market, in order to profit from excessive money supply growth, by simultaneously shorting government bonds and buying gold. This way, if central banks try to artificially depress bond yields with excessive money supply, the resulting inflationary pressures would ultimately show up in a higher gold price.
For example, since May 2004, the Euro M3 money supply has accelerated from a 4.9% growth rate to as high as 11.6% in August 2007. During that time, German bund prices gyrated up and down, but today, are little changed since May 2004. But when measured against the price of gold, the German 10-year bund has lost 40% of its value to a ratio of 0.22 Euro.
Thus, gold has a very special role to play, as a hedge for fixed income investors from abusive central bankers. It's a mystery, why most institutional traders, seeking a “safe haven” during times of financial turmoil, such as the current sub-prime debt debacle, prefer to buy government bonds and avoid buying the yellow metal, especially when central banks are flooding the banking system with cheap money.
Japanese bonds in Bear market, Tokyo Gold at all-time highs
The Bank of Japan has pegged its overnight loan rate at an abnormally low 0.50% since February, exporting inflation around the globe. “I cannot deny that monetary conditions remain very accommodative,” said BoJ chief Toshihko Fukui on Sept 19th. “If market participants come to believe that such conditions will last for ever, it would undoubtedly create distortions in asset allocation. Yet there is no need to adjust interest rates if the economy moves in line with our scenario.”
Since October 2002, the Bank of Japan has bought 1.2 trillion yen of government bonds each month, to pump more money into the economy, and keep the yen weak in the foreign exchange market. The BoJ will monetize more than half of the government's budget deficit this year, expected around 25 trillion yen. Such massive money pumping has led to a doubling of Tokyo gold prices to a record 85,500 yen from four years ago, while knocking government bond prices into a bear market
Tokyo gold traders have not been duped by the government's brainwashing and fuzzy math on inflation. Japan's financial warlords paint an economy that is flirting with deflation, with core consumer prices falling -0.1% from a year ago. Few traders believe the phony statistics on inflation anymore, but they still serve to provide political cover for the Bank of Japan's ultra low interest rate policy.
By flooding the Japanese bond market with enormous liquidity, and ruling out a rate hike in August, Fukui put a floor under the 10-year JGB market in July, and capped yields at 2.00 percent. However, artificially low interest rates in Japan and elsewhere are providing fertile ground for speculators in global commodity and stock markets. Thus, the BoJ is exporting inflation worldwide, thru it ultra-easy low interest rate policy, via the mammoth $1.05 trillion “yen carry” trade.
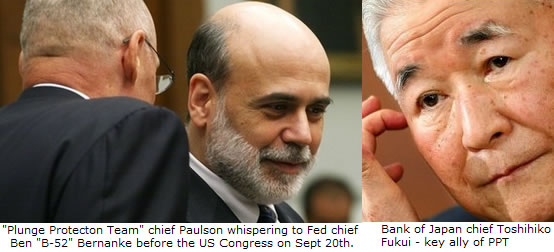
Fukui is a stalwart ally of the “Plunge Protection Team” headed by the dynamic duo of US Treasury chief Henry Paulson and Fed chef Ben “B-52” Bernanke. “We regularly keep in touch with overseas central banks on market developments and share each other's understanding. That is something we do all the time. But when financial markets are volatile, we are even more closely in contact with each other so that we come up with a common understanding.” Fukui said on August 23rd.
By putting a lid on 10-year Japanese bond yields at 2.00%, Fukui also put a ceiling on the US 10-year T-Note yield at 5.25% in July, sparing further damage to the US housing market. With Fukui pumping 1.2 trillion yen into the Tokyo money markets each month, Mr Bernanke can run the US money printing presses at full speed, with little fear of a collapse of the US Treasury bond market.
US Economy headed for the “Stagflation” Trap
It would be especially difficult to forecast the direction of US Treasury yields, if the world's largest economy gets snared in the “Stagflation” trap, with a weakening economy accompanied by higher inflation. On the one hand, a weaker economy could encourage the Bernanke Fed to slash the fed funds rate, and anchor yields at lower levels. On the other hand, an easier Fed policy can crush the US dollar and trigger higher inflation, especially in the global commodity markets.
Since mid-July, US 10-year Treasury Notes have rallied strongly, lowering the yield from as high as 5.25% in July to 4.50% today. Yet when measured against the price of gold, US T-Notes actually fell from 41-cents on the dollar to as low as 37.5-cents. Investors seeking shelter from the global sub-prime mortgage crisis were much better off buying an ounce of gold, rather than the US Treasury's IOU's.
US Treasury yields are no longer a reliable indicator about inflation expectations. Instead, the Treasury bond market is simply a parking lot for foreign central banks that peg their currencies to the greenback, and want to earn some interest on their dollar reserves. But if the US dollar remains chronically weak, due to Fed rate cuts, one has to wonder if dollar pegs in China and the Persian Gulf might unhinge.
Yu Yongding an adviser to the Chinese central bank predicted as far back as Dec 30, 2005, that the Fed might stop raising interest rates in 2006 and start guiding the dollar downward, putting upward pressure on the yuan. “More seriously, China's economy would take a big hit if the US dollar weakened sharply due to such factors as a bursting of the US property bubble. The loss for China's foreign exchange reserves would also be extremely serious,” he said. China has $1.4 trillion in foreign exchange reserves, double the amount held in Q'4 2005.
On March 26th, Bernanke was asked what would happen to US interest rates, if China began dumping some of its $408 billion position in Treasury bonds. “If such a shift were to put undesired upward pressure on US interest rates, the Federal Reserve has the capacity to operate in domestic money markets to maintain interest rates at a level consistent with our economic goals,” Bernanke replied.
Thus, while the Fed could buy large sums of bonds from China and set a floor under the market, it would have to turn up the printing presses to accomplish that feat. That could send the price of gold soaring, once Beijing finally relents to a significant dollar devaluation against the Chinese yuan. Such as scenario is unlikely any time soon under Paulson's watch, but could happen if the protectionist bent Democrats capture the White House and Capitol Hill in 2008.
The latest downturn in US Treasury Notes, when measured in “hard money” terms, extends an unrelenting bear market that has prevailed since 2003, when the T-Note to Gold ratio peaked at 87-cents. Nevertheless, on Sept 20th, Bernanke said the Fed would remain vigilant on inflation. “We will continue to pay very close attention to the inflation rate. It is an important part of our mandate and I agree that an economy cannot grow in a healthy, stable way when inflation is out of control, and we will certainly make sure that doesn't happen,” he told lawmakers on Capital Hill.
By Gary Dorsch,
Editor, Global Money Trends newsletter
http://www.sirchartsalot.com
This article is just the Tip of the Iceberg, of what’s available in the Global Money Trends newsletter! Here's what you will receive with a subscription, Insightful analysis and predictions for the (1) top dozen stock markets around the world, Exchange Traded Funds, and US home-builder indexes (2) Commodities such as crude oil, copper, gold, silver, the DJ Commodity Index, and gold mining and oil company indexes (3) Foreign currencies such as, the Australian dollar, British pound, Euro, Japanese yen, and Canadian dollar (4) Libor interest rates, global bond markets and central bank monetary policies, (5) Central banker "Jawboning" and Intervention techniques that move markets.
GMT filters important news and information into (1) bullet-point, easy to understand analysis, (2) featuring "Inter-Market Technical Analysis" that visually displays the dynamic inter-relationships between foreign currencies, commodities, interest rates and the stock markets from a dozen key countries around the world. Also included are (3) charts of key economic statistics of foreign countries that move markets.
A subscription to Global Money Trends is offered at only $150 US dollars per year for “44 weekly issues”, including access to all back issues. Click on the following hyperlink, to order now, http://www.sirchartsalot.com/newsletters.php Call toll free from USA to order, Sunday thru Thursday, 2 am to 4 pm EST, at 866-576-7872.
Mr Dorsch worked on the trading floor of the Chicago Mercantile Exchange for nine years as the chief Financial Futures Analyst for three clearing firms, Oppenheimer Rouse Futures Inc, GH Miller and Company, and a commodity fund at the LNS Financial Group.
As a transactional broker for Charles Schwab's Global Investment Services department, Mr Dorsch handled thousands of customer trades in 45 stock exchanges around the world, including Australia, Canada, Japan, Hong Kong, the Euro zone, London, Toronto, South Africa, Mexico, and New Zealand, and Canadian oil trusts, ADR's and Exchange Traded Funds.
He wrote a weekly newsletter from 2000 thru September 2005 called, "Foreign Currency Trends" for Charles Schwab's Global Investment department, featuring inter-market technical analysis, to understand the dynamic inter-relationships between the foreign exchange, global bond and stock markets, and key industrial commodities.
Copyright © 2005-2007 SirChartsAlot, Inc. All rights reserved.
Disclaimer: SirChartsAlot.com's analysis and insights are based upon data gathered by it from various sources believed to be reliable, complete and accurate. However, no guarantee is made by SirChartsAlot.com as to the reliability, completeness and accuracy of the data so analyzed. SirChartsAlot.com is in the business of gathering information, analyzing it and disseminating the analysis for informational and educational purposes only. SirChartsAlot.com attempts to analyze trends, not make recommendations. All statements and expressions are the opinion of SirChartsAlot.com and are not meant to be investment advice or solicitation or recommendation to establish market positions. Our opinions are subject to change without notice. SirChartsAlot.com strongly advises readers to conduct thorough research relevant to decisions and verify facts from various independent sources.
Gary Dorsch Archive |
© 2005-2022 http://www.MarketOracle.co.uk - The Market Oracle is a FREE Daily Financial Markets Analysis & Forecasting online publication.