


Stock Market Intermediate Term Decline Underway
Stock-Markets / Financial Markets 2010 Nov 13, 2010 - 06:37 AM GMTBy: Steven_Vincent

 I've been seeing technical divergences for weeks now and so far no real pullback has resulted. The major indices have now taken out the April highs and have been trading at those levels for about a week now. As a result there are now across the board technical divergences within the context of the rise off the August bottom as well as divergences between the April high and current prices.
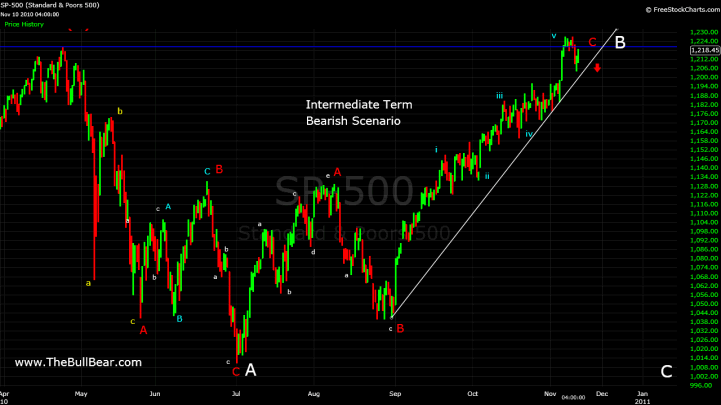
The move off of the QE2 announcement started out like a wave 3 move but has since stalled and the technicals have not really shown the kind of internal strength that would be associated with a wave 3. I'm looking at the recent highs as probably a wave 5 off the August bottom. In that context I am looking for an intermediate term pullback to start anytime now.
The Euro has indeed broken down -- as forecast in the previous report -- out of an abcde rising wedge pattern. I think it's got more downside to at least the 38.2% Fib retracement of the recent rally.
General asset price direction is tied to the fate of the EuroDollar at this time, with markets tethered to the dollar inflation trade and subject to a bout of fear as questions surrounding Portugal and Ireland mount.
"When the market is ready the reason will appear". Tonight Cisco announced earnings and the market did not like the results or the guidance. CSCO fell by 12%. Nasdaq 100 futures appear to have broken key support.
The uptrend from the August bottom is gone and we have an upside wedge breakout that has failed back through the formation, a particularly bearish occurrence. If this move holds and we sell down on Thursday then we probably have the beginnings of an intermediate term decline.
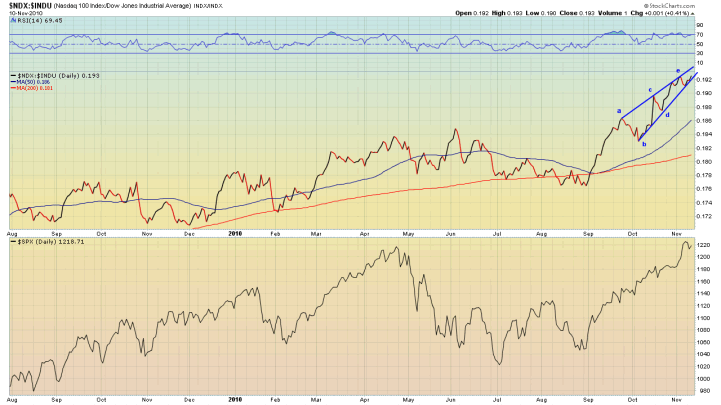
The Nasdaq 100 to Dow Industrials ratio has been very bullish but it appears to have made a completed abcde rising wedge pattern.
NYSE is showing an RSI pattern similar to that shown prior to the April top.
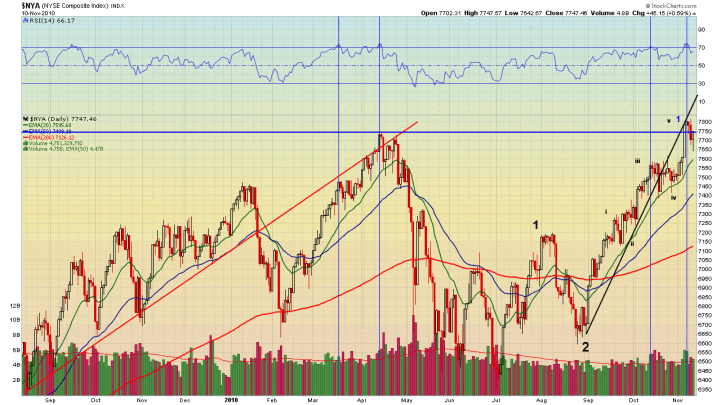
Note that I am labeling this as wave 1 of 3, which is an entirely different animal from the April top, which was a clear wave 5 of 1. Assuming that the wave count is correct, the correction from this top would be of a lesser degree.
Naturally if a decline does begin, the bears will be jumping up and down screaming "Double Top". At this time I am probably looking for something similar to the June 2009 or Feb 2010 corrections.
We do need to keep the alternate view in mind at all time, of course. At this time it takes substantial mental gymnastics to come up with a purely bearish long term wave count, but the count below allows for a full retracement of the recent move within the context of a very large ABC expanded flat correction after which the bull market would continue.
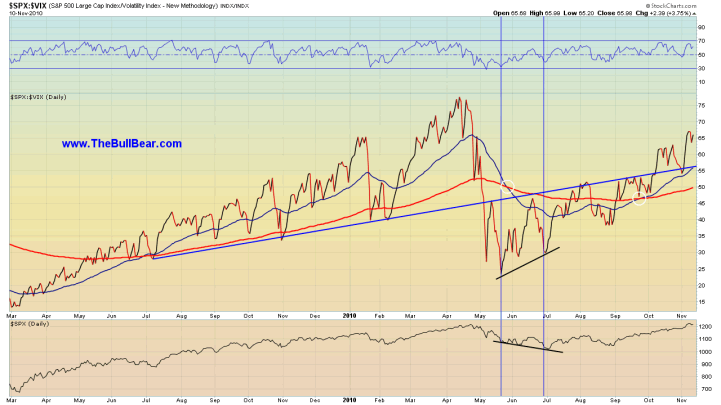
SPX:VIX looks bullish and recently successfully retested its breakout and 50 EMA.
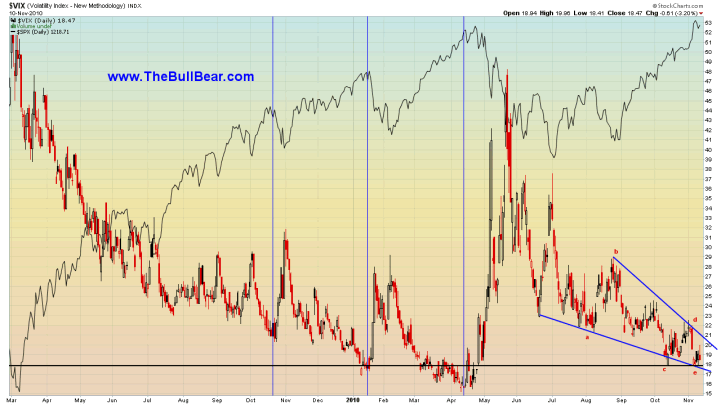
But a look at VIX itself reveals a bullish descending wedge that has fallen to support and looks ready for an upside breakout.
SPX to Total Put-Call Ratio has risen sharply lately. On the surface that looks bullish but it may represent some capitulation in the options market.
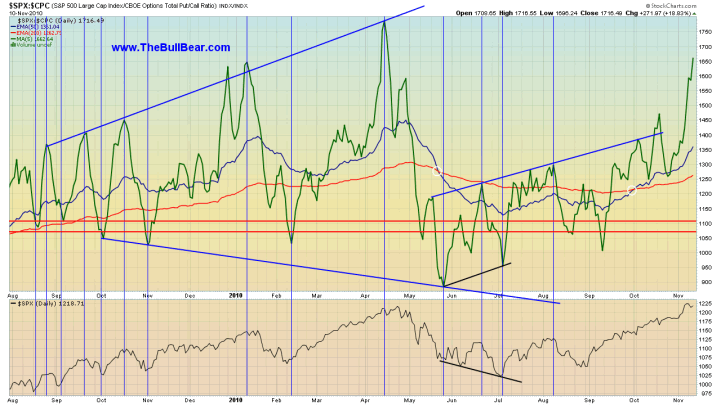
Total Put Call Ratio itself shows a spike to key support at .70 where market tops have occurred in the past as options players plunge into calls. In this case it is professional Index options players that have capitulated, not retail Equity players.
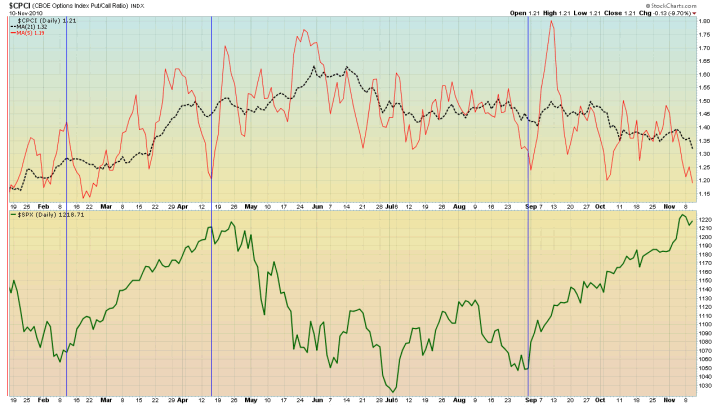
Index options players are frequently sellers of option premium so they may be rushing at the top to take advantage of high call premiums in order to hedge their long term positions with covered calls. This happened in April as well just before the top.
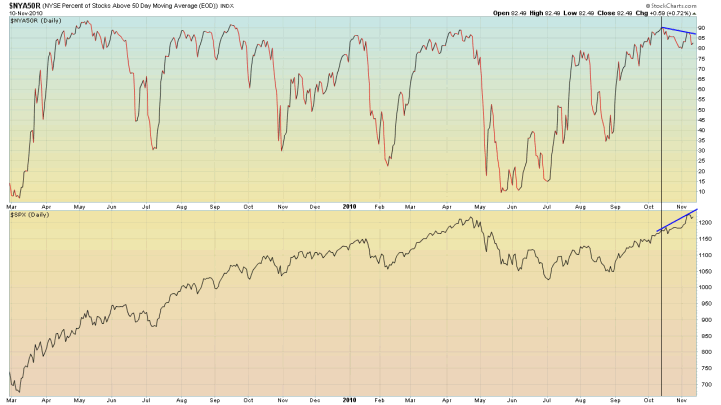
In early October, Stocks Above the 50 Day EMA topped out at levels frequently associated with a market high. Recently, the indicator has apparently made a lower high even as the market has moved up creating a divergence.
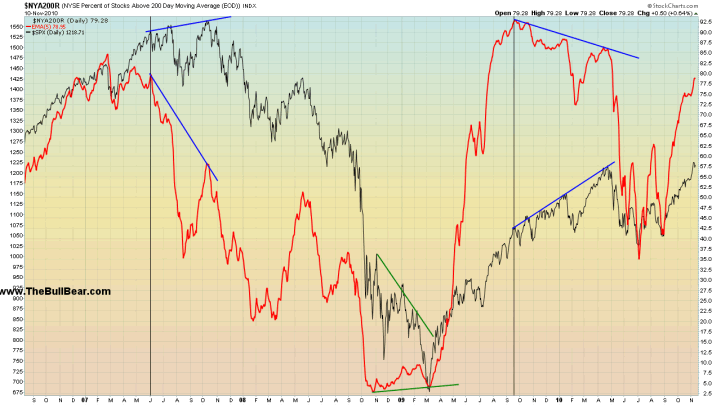
Stocks Above the 200 Day EMA showed divergence over a period of several months at the 2007 and April 2010 tops. There is now a divergence between the recent high and the April 2010 top which resembles the divergence between the July 2007 and October 2007 tops.
The McClellan Oscillator is showing a divergence similar to those shown at the January and April tops.
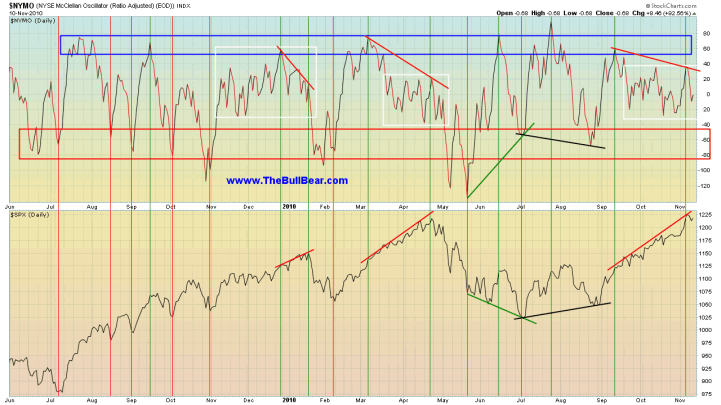
The white boxes show an area of lengthy consolidation in the vicinity of the 0 line after which the indicator breaks down with the market.
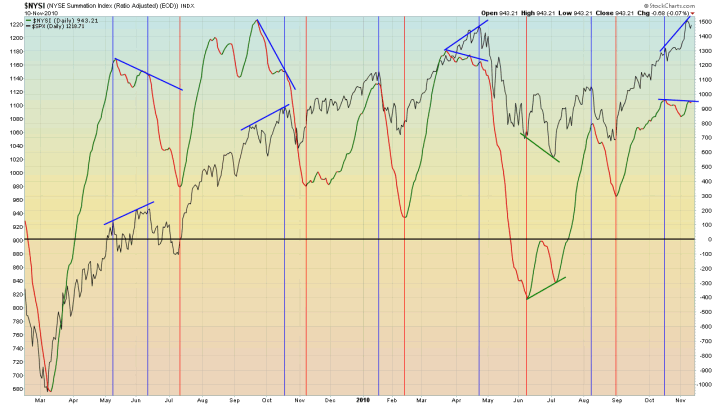
The Summation Index is also showing a divergence in the context of the rally from the August low. It's not big, but it's there. Like virtually all of the indicators there is also a divergence with the April high.
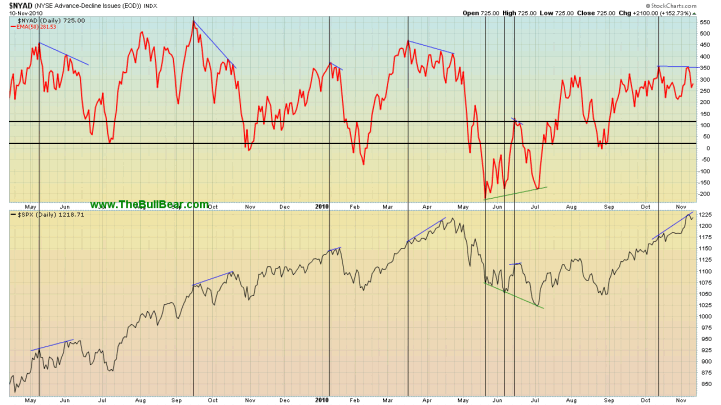
Advance-Decline Line is showing a recent divergence.
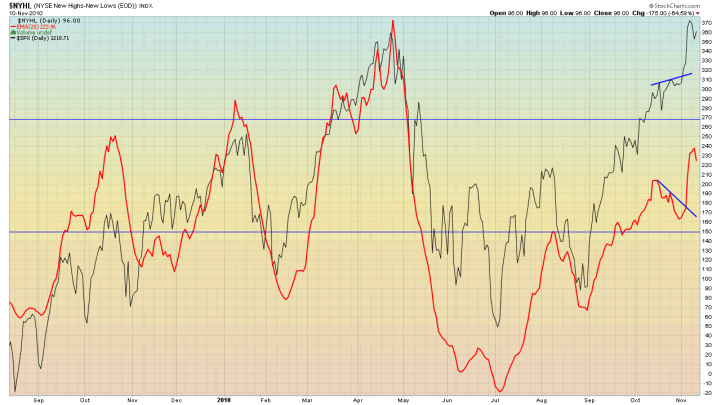
New High-New Low Ratio:

The fact that NHNLR never really got off the ground on this move is a bit disconcerting.
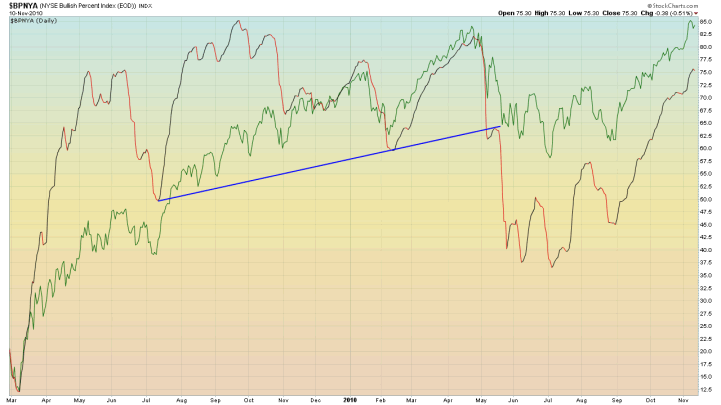
Bullish Percent Index looks awesome however, though it has not reached its April highs.
New Highs-New Lows is confirming recent highs but is well below the April high.
I'm really not all that concerned about the divergences with the April highs because this rally so far does not represent a full wave 3 but rather only 1 of 3. In my view it just means that on a longer term basis there is room to run before becoming overbought on these indicators. If the decline takes on more bearish characteristics then we will have to take another look at the count and may need to give these longer term divergences more weight. But I think that they will actually end up being "Wall of Worry" material that gets many traders bearishly wrong footed looking to short a long term decline rather than buy an intermediate term pullback. Robert Prechter is already bringing up such divergences to bolster his view that Wave 3 down is about to begin.
SPX to 30 Year Treasury ratio is challenging its downtrend from 2007 and its 50 Month EMA.
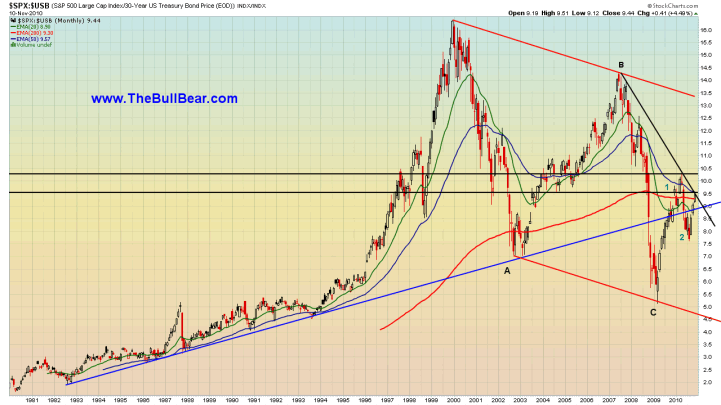
A breakout above this cluster of resistance and a move of the 20 EMA above the 50 and 200 EMAs would put this ratio in full long term bull market mode. Note that the 50 EMA has never crossed below the 200 EMA so on a very long term basis we have not been in a bear market for risk assets, only a correction. This has huge implications. Of course, if the 50 EMA does cross the 200 EMA with price below the long term uptrend then we would have technical confirmation that a very long term bear market in risk assets is in force.
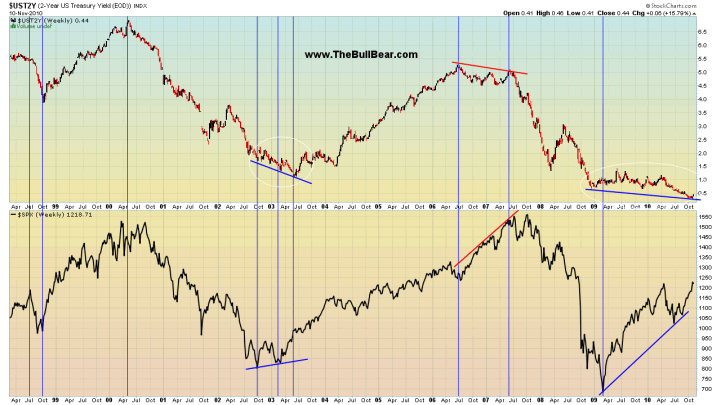
The 2 Year Treasury yield is showing signs of bottoming. If money starts to move out of the short end as well as the long end of the Treasury market it will be moving into risk assets and will provide the rocket fuel for a big Wave 3 of 3.
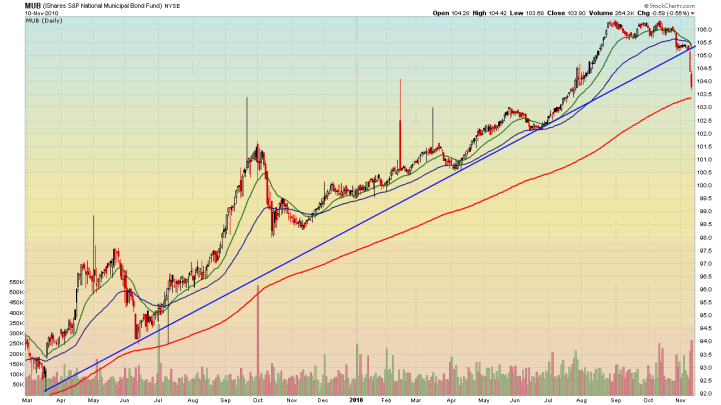
The Municipal Bond ETF has broken support with authority. Is this more money moving from safety to risk or is there something happening in the Muni market that the market is telegraphing?
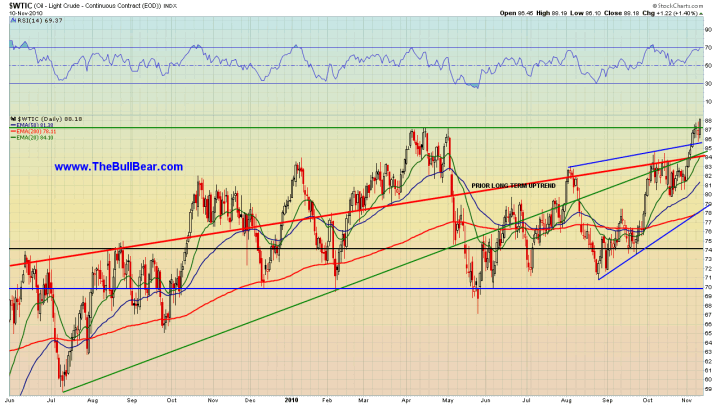
Crude Oil's breakout is encouraging but if it fails it may also be a signal that the current run up in risk is at its end.
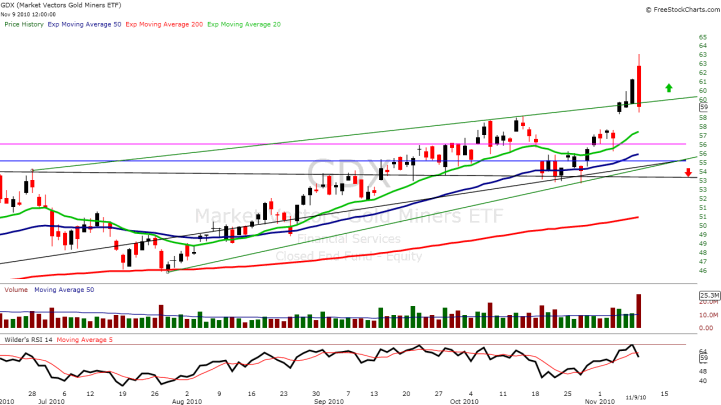
Gold may very well have completed a V of V of 5 for a Major Wave III top.
There are a number of long term Fibonacci extension levels in the $1345-1375 area. This is just one example.
There was a massive intraday reversal in gold mining stocks on Tuesday leaving a bearish engulfing candle. Not what you would expect on a market that is set to go "to da moon!".
It's time to have another look at DollarYen. The weekly chart shows that the breakdown from the falling wedge may leave behind a bear trap.
The daily chart shows that there is a cluster of trend and moving average resistance but if it breaks above it should produce a powerful move.
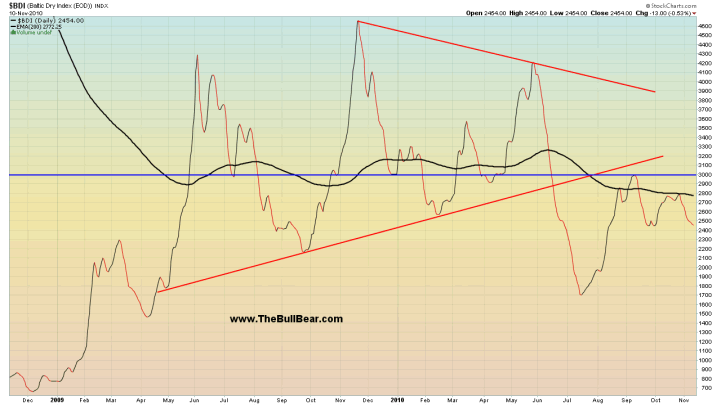
Baltic Dry Index is languishing below its 200 Day EMA after testing resistance. Is this a message about international trade?
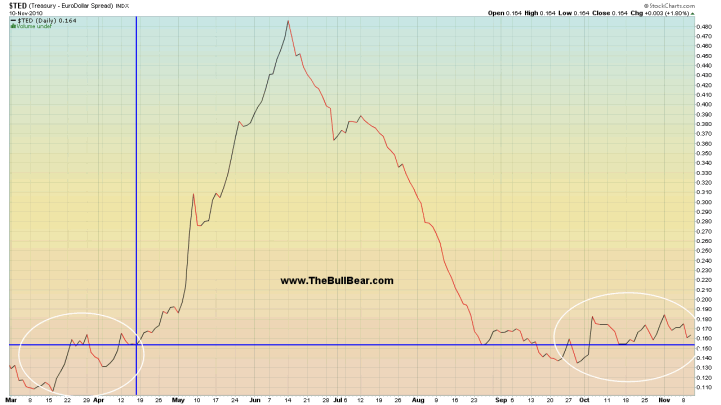
The TED spread is showing behavior similar to what it showed prior to the outbreak of the European sovereign debt crisis. It may be nothing but worth keeping an eye on.
Conclusion:
Traders should be taking some long money off the table here and gearing up to buy after an abc decline. It could last about 1-2 weeks, maybe less. The spark could be any bit of news from Europe. I would not recommend shorting because the decline could be very short lived. Again, the setup is for a pullback within the context of a wave 3 bull move, not a major top. When Prechter comes on CNBC and tells the world that the End is Nigh, it may be time to buy.
Generally these reports as well as twice weekly video reports are prepared for BullBear Trading Service members and then released to the general public on a time delayed basis. To get immediate access just become a member. It's easy and currently free of charge.

Disclosure: No current positions.
By Steve Vincent
Steven Vincent has been studying and trading the markets since 1998 and is a member of the Market Technicians Association. He is proprietor of BullBear Trading which provides market analysis, timing and guidance to subscribers. He focuses intermediate to long term swing trading. When he is not charting and analyzing the markets he teaches yoga and meditation in Los Angeles.
© 2010 Copyright Steven Vincent - All Rights Reserved Disclaimer: The above is a matter of opinion provided for general information purposes only and is not intended as investment advice. Information and analysis above are derived from sources and utilising methods believed to be reliable, but we cannot accept responsibility for any losses you may incur as a result of this analysis. Individuals should consult with their personal financial advisors.
© 2005-2022 http://www.MarketOracle.co.uk - The Market Oracle is a FREE Daily Financial Markets Analysis & Forecasting online publication.