


The Most Important Stock Market Chart of the Week
Stock-Markets / Stock Markets 2010 Dec 13, 2010 - 10:55 AM GMTBy: Jared_Levy

 Early last week I gave you four reasons to buy the S&P 500 market (SPX or SPY), and hopefully you had the chance to participate in the market's recent gains. Aside from the somewhat positive fundamentals of both the macroeconomic improvements and individual companies' improved fiscal health, we have year-end window dressing and some good old statistical (and superstitious) beliefs working in your favor, especially if you are a bull.
What I have not addressed yet are some of the key technical levels that you need to be aware of. In just about every stock trade I make, I am paying close attention to a minimum of two stock market charts (usually more). I don't just analyze the stock that my investment is in, but also a large index, such as the SPX, OEX, NDX or similar.
Don't Pay Attention to the Dow Jones Industrial Average
I do NOT use the Dow Jones Industrial Average, because I feel the index is flawed in that it concentrates on the price of the stock for its weight in the index as opposed to its real value. In addition, to me, 30 stocks out of the over 5,000 stocks that trade on major exchanges is just not a good sample size. But I digress...
The S&P 500 Can Show You the Market's "Hand"
Out of all the commonly watched indexes out there, the S&P 500 or SPX is the preferred barometer of most professional traders, because of its breadth and diversity. The S&P 500 is a collection of about 500 stocks (it varies at times) that cross many sectors. The price levels of the S&P 500 are not only used as major support and resistance for traders, but they can send individual stocks higher or lower.
There is a unique characteristic about big indexes and ETFs like the SPX and SPY. You would think the index itself is just telling us where stocks are; in other words, it gets its value from the changes in the stocks. But because of arbitrage, the behavior of ETFs and the weighing of certain stocks within that index, it sometimes works the other way around. When roles reverse, the tail wags the dog, so to speak, and the index determines where many stocks are headed. I mean, why do you think experts are always quoting support and resistance levels in the indexes if they were only monitors for the hundreds of stocks within them?!
So today, I am going to tell you the levels you need to watch out for and where I think we may head from here.
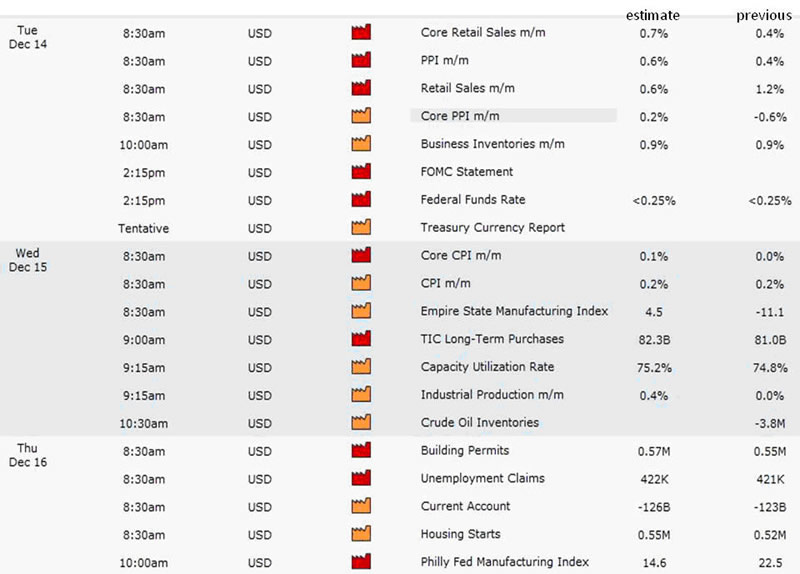
Economic Calendar
This week's economic docket is chock-full of data and potential market movers. Unlike last week, where the expectations were for quiet sailing, expect movement as we progress through the second week of December.
Check out the chart below for all the economic data and estimates due out this week.
Chart courtesy of forexfactory.com
The Levels You Need to Be Aware Of
The chart of the SPX below tells us much about the current trend and why we need to watch the 1,221 support level very carefully. That number was not only the former high made back in April, but it was also a support level formed back in July of 2008. The recent breakout about this level is and continues to be a bullish sign, but a violation below it could mean the SPX could drop to its next support level of 1,170. If you are currently long and notice the SPX breaking below 1,221, and if it's looking like it might close below that level, you might want to evaluate that long position for an exit.
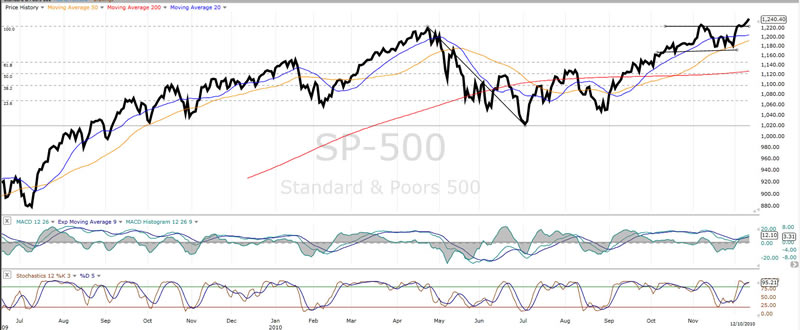
For now, barring any adverse data this week, the market is struggling higher. However, watch for late-day weakness and note the stochastic hanging out in the overbought area, which is typical, but not something to be ignored. Also keep your eye on the 20-day moving average compared to the 50-day moving average. Right now, the 20-day is on top, but converging into the 50. If they cross, that could be our signal that at least the short-term trend is over.
Don't be greedy this week and make sure you tell your friends about Smart Investing Daily! And if you want a more in-depth understanding of how technical indicators work... even how to use them for trading, you should check out WaveStrength Options Weekly, a service run by Adam Lass. Here are more details.
Don't forget to follow us on Facebook and Twitter for the latest in financial market news, investment commentary and exclusive special promotions.
Source : http://www.taipanpublishinggroup.com/tpg/smart-investing-daily/smart-investing-121310.html
By Jared Levy
http://www.taipanpublishinggroup.com/
Jared Levy is Co-Editor of Smart Investing Daily, a free e-letter dedicated to guiding investors through the world of finance in order to make smart investing decisions. His passion is teaching the public how to successfully trade and invest while keeping risk low.
Jared has spent the past 15 years of his career in the finance and options industry, working as a retail money manager, a floor specialist for Fortune 1000 companies, and most recently a senior derivatives strategist. He was one of the Philadelphia Stock Exchange's youngest-ever members to become a market maker on three major U.S. exchanges.
He has been featured in several industry publications and won an Emmy for his daily video "Trader Cast." Jared serves as a CNBC Fast Money contributor and has appeared on Bloomberg, Fox Business, CNN Radio, Wall Street Journal radio and is regularly quoted by Reuters, The Wall Street Journal and Yahoo! Finance, among other publications.
Copyright © 2010, Taipan Publishing Group
© 2005-2022 http://www.MarketOracle.co.uk - The Market Oracle is a FREE Daily Financial Markets Analysis & Forecasting online publication.