


US Treasury Bonds BubbleOmics: Next Stop 2.890% for the 10-Year
Interest-Rates / US Bonds Dec 20, 2010 - 02:11 AM GMTBy: Andrew_Butter

 A bubble is when for some reason, be it because of manipulation of markets for one person’s gain and another’s pain, the insanity of crowds, or addiction to debt; prices of some “thing” gets wildly out of synch with the fundamental utility value of the thing.
Then there is a marked difference between what, in Wall Street slang, you can sell something for to someone dumber than you, today (Market Value); and what can reasonably expect to be able to sell same the thing for to someone smarter than you, tomorrow (Other than Market Value).
Of late the gurus have been saying that US Treasuries are a bubble.
And there has been a lot of debate on that; although the “correct” yield on 10-Year and 30-Year US Treasuries (Other Than Market Value) is something that you would think Nobel Prizewinning economists could work out on the back of an envelope?
On the one hand…”as one might say” (in the words of Allan Greenspan)… when the great-guru-economists of the 21st Century are consulted for their thoughts on that subject, they have plenty to say…”inflation expectations”…”confidence”…”train left the station”…”Black Swan”…etc, etc.
On the other hand, the problem for us simple mortals is that they don’t all say the same thing. And in any case none of them come up with a number, which is confusing, and the chances of finding two that do say the same thing is about the same as spotting two Black swans in a walk through the woods. That’s why economics is considered to be an “Art-Form”, as in Abstract Expressionism.
The story right now starts in February 2010. Back then, Nouriel Roubini and Nassim Taleb, who made their names by both correctly predicting important things like, when governments drive drunk they are likely to crash; agreed unanimously, or should I say magnanimously, that US Treasury yields were set to sky-rocket and that only a moron would not short them.
WOW!! Two economic gurus agreeing – that’s almost like a Hindenburg Omen!!
Sadly yields went steadily downwards from that point (which was the wrong direction); for example from 4.6% for the 30-Year to 3.6%. If you had timed that to perfection you would have lost a bundle; so much for free-advice!
Part of the “problem” (in the prediction), was those darned speculators, who got wind of the idea that Ben was going to print some more money, and so they started to front-run the market. But that’s over now; the Fed paid over-the odds for their Treasuries and the speculators pocketed the difference (thank you very much). That’s Wall-Street and the Fed working the market in perfect harmony, just like the old days!!
Now yields are more or less back where they were in February. So is now the time for anyone who is “not a moron” to short the market?
Here’s some more free advice:
The real question is what is the “fundamental” price for the 10-Year and the 30-Year right now? What “fundamental” means in that context is what would the price be if the traders had lot lost their senses (happens more often than many people think), and/or if no one was manipulating the market; in valuation-speak (well International Valuation Standards anyway), that’s called the Other-Than-Market-Value.
There are two ways you can work that out (on the back of an envelope).
The first way is to look for “drivers” of long-term yields in the past on the assumption that history is a guide to the future. Yes-yes, I know…”Assumption is the mother of all Frappuccinos”, but all the same, here are two “drivers” that are popular, in this case based on year on year data in the US from 1950:
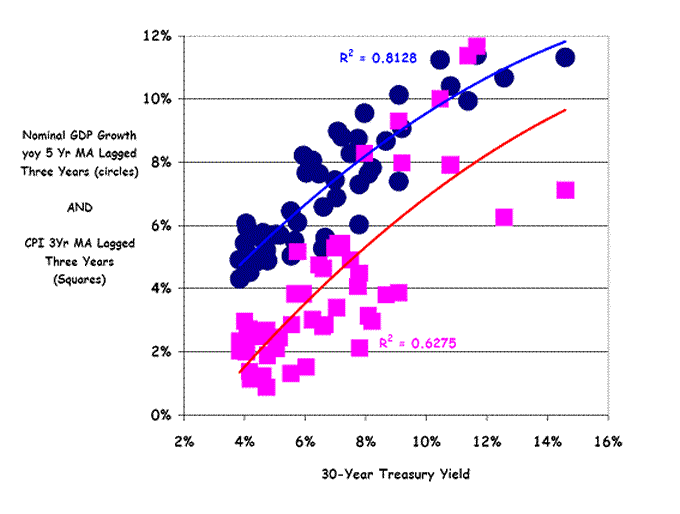
OK…OK, I know I should have put the dependent variable on the “Y” axis, but I drew it like that for comparison, and to achieve some sort of existential visual balance…”as one might say”.
That’s the best fit I could find, irritatingly (if you want to make a prediction), the best explanatory variable comes from drivers in the past; so for example here, what happened over the past eight years on average matters for what’s happening now.
Sorry about that. I agree, it would have been great to have been able to build a model for yields based on next-year’s nominal GDP growth or the Black-Swan count, or something, but sadly, in this case, the past appears to be a better predictor of the future than the future.
In any case, if history is a guide, then looking at that graph, it’s hard to see the 30-Year punching up above 4% any-time soon. Of course that’s not accounting for the “News-of-the-World-Order” or some other variant of a Black Swan.
And I agree too, that’s not very convincing, although being able to explain 81% of changes in the 30-Year since 1950 is not bad…for Government Work…”as you might say”.
BubbleOmics:
But don’t despair, here’s a neat trick that seems to work pretty good if there are bubbles…at least it worked pretty good on the S&P 500, housing (more or less), and oil (struck-out for gold, but that’s another story).
The trick is that there is that if there is a bubble, then there is an immutable Law of Nature that, for short-time-span bubbles, the “fundamental” is by definition, at the exact point defined by the square-root of the “Top” (of the bubble), multiplied by the “Bottom” of the slump that follows, after the bubble pops.
That’s how you can work out the “fundamental” at a specific point in time.
So if you take the 10-Year:
>>On 15th December 2008 there was a bubble (the price of a bond is the inverse of the yield), caused by a story going round that the financial gurus in league with the abstract expressionists, had colluded to engineer the end-of-the world. On that day the yield of the 10-Year was 2.131%.
>>Six months later, after Hank Paulson “saved the world”, or was it Tim Geithner…or George Brown? I forget, anyway the yield was 3.862%.
That says using simple arithmetic (and I apologise for bringing complicated “math” into a discussion about abstract expressionism), that the “fundamental” (Other-Than-Market Value), was √(2.131 x 3.862) = 2.869%.
OK, then life went on, the world breathed a sigh of relief, and the bankers all got paid their bonuses as they are entitled to under some sort of Divine Law, but then, blow me down, it happened again…as in, “Give it to me one more time…baby”!!
>>On 8th October 2010 the yield was down to 2.381.
>>Then all the “front runner’s” cleaned up, just in time to fund their Christmas-bonuses, and the yield popped up to 3.52%.
Of course you can’t be sure that’s the bottom (i.e. the top in the yield), but let’s pretend it is, for now. In which case the “fundamental” was √(2.381 x 3.520) = 2.895%.
That’s 1% more than it was “estimated” (yes, a valuation is an estimate), about a year ago; which probably makes sense because although the fundamental moves up and down slowly over time (by definition), it’s probably safe to say that after all the bail-outs, stress tests, PPIP, stimulus, and other sources of hot air, the prospects for the US economy are easily 1% better today, than they were a year ago.
Timing:
Well the last bubble was only two months, so by say 20th February, the yield should be knocking on 2.89% or so.
QED.
By Andrew Butter
Twenty years doing market analysis and valuations for investors in the Middle East, USA, and Europe; currently writing a book about BubbleOmics. Andrew Butter is managing partner of ABMC, an investment advisory firm, based in Dubai ( hbutter@eim.ae ), that he setup in 1999, and is has been involved advising on large scale real estate investments, mainly in Dubai.
© 2010 Copyright Andrew Butter- All Rights Reserved
Disclaimer: The above is a matter of opinion provided for general information purposes only and is not intended as investment advice. Information and analysis above are derived from sources and utilising methods believed to be reliable, but we cannot accept responsibility for any losses you may incur as a result of this analysis. Individuals should consult with their personal financial advisors.
Andrew Butter Archive |
© 2005-2022 http://www.MarketOracle.co.uk - The Market Oracle is a FREE Daily Financial Markets Analysis & Forecasting online publication.