


BP and Toyota Motors bad stocks of 2010, maybe not !
Companies / Company Chart Analysis Jan 19, 2011 - 01:12 PM GMTBy: readtheticker

In 2010, we all remember BP and their horrific oil spill in the Gulf of Mexico. We also remember Toyota Motors issue with their brake faults. Both stocks suffered mini crashes, however both companies can be regarded as high quality with plenty of cash, both took it on the chin and said they would fix it, in which they did and are.
So what would a savvy investor do, look for opportunity of course.
And what would William Gann have done, I wonder.
We at readtheticker.com are great fans on Gann angles methods. Many dont know how to apply them nor know how to trade around them. One of the great aspects of angles is that they only require one point on the chart where as a trendline requires two, believe it or not that's an advantage.
Gann angles are like a stock trend speed test, how fast is price moving (vertical axis) relative to time (horizontal axis). For example, a 45 degree angle is 1 unit in time to 1 unit in price or 1x1. A 63.75 degree angle is 1 unit of time for 2 units of price or 1x2. So as an investor I would very much like my investment to grow at least 2 units of price to each unit in time. If you want more details on how to trade and draw can angles on computer charts I suggest you visit readtheticker.com to learn more.
Note: Readtheticker.com Gann charts are true (1x1) time squaring of price charts. The angles are not apportioned or adjusted to fit, they a drawn true to the degrees stated.
Let's review BP.
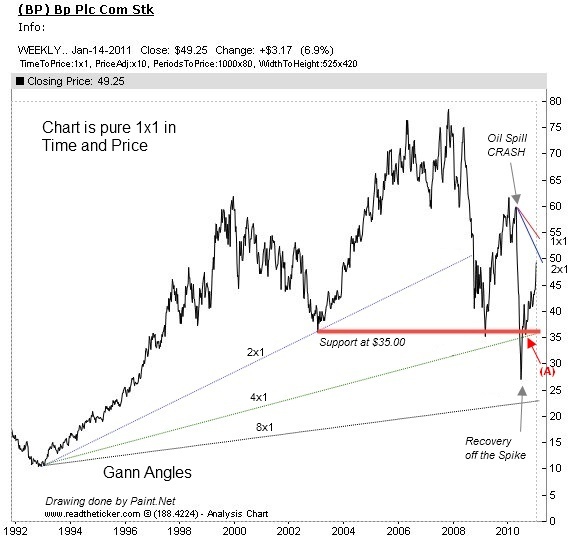
On the oil spill news crashed price from $60 to $27. Price bounced back through the Gann angle 15 degrees (4x1) and sold of back gently to strong support at $35. This mild sell off to $35 at (A) is called a 'price test', that is a mild sell off to determine if sellers are still in the market, if they are price would fall further, if not price would reverse higher as the bulls realized that sellers will not frustrate higher prices as the selling is mostly likely exhausted. This bullish price action off the 4x1 line (15 degrees) is the buy signal Gann would consider. The resulting investment so far has rendered (49.25 - 35.00) $14.25 or 42% return. Not bad when all the news was so very very bad. The Gann investor profited very well.
Let's review Toyota Motors (TM).
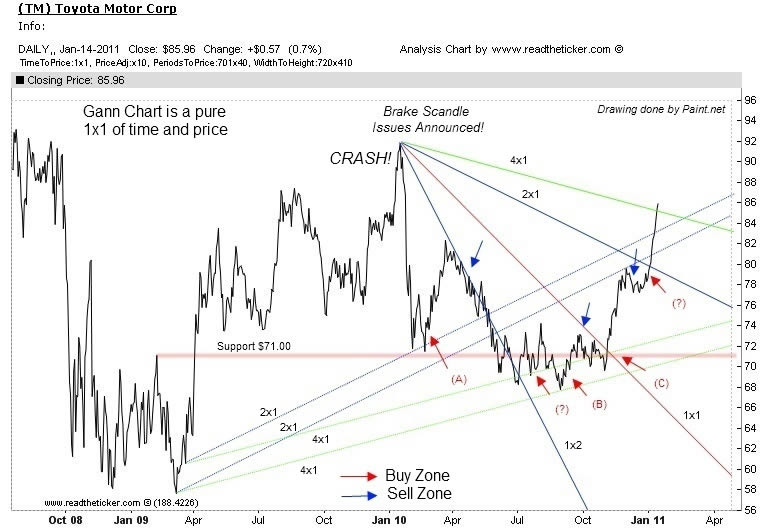
On the news of the recall of Toyota cars with break issues the stock price mini crash fell from $92 to $72. Just what the struggling American car industry needed to boost their local product via Ford and General Motors. Congress made a meal of Toyota, again and again. Once again Gann wouldnt touch price while it crashes, however once price settled on the first 2x1 (26.25 degrees) completed a test (as discussed above) or more commonly know as a double bottom off the 2x1 angle, he would consider buying at (A). Other possible entry buy decisions can be found at (B) and (C). Subject to your stop rules buying around $70 would currently return (86-70) $16 or 22% return. Not bad at all.
Disclosure: Currently readtheticker.com holds no positions in either security
Readtheticker
My website: www.readtheticker.com
My blog: http://www.readtheticker.com/Pages/Blog1.aspx
We are financial market enthusiast using methods expressed by the Gann, Hurst and Wyckoff with a few of our own proprietary tools. Readtheticker.com provides online stock and index charts with commentary. We are not brokers, bankers, financial planners, hedge fund traders or investment advisors, we are private investors
© 2011 Copyright readtheticker - All Rights Reserved
Disclaimer: The material is presented for educational purposes only and may contain errors or omissions and are subject to change without notice. Readtheticker.com (or 'RTT') members and or associates are NOT responsible for any actions you may take on any comments, advice,annotations or advertisement presented in this content. This material is not presented to be a recommendation to buy or sell any financial instrument (including but not limited to stocks, forex, options, bonds or futures, on any exchange in the world) or as 'investment advice'. Readtheticker.com members may have a position in any company or security mentioned herein.
© 2005-2022 http://www.MarketOracle.co.uk - The Market Oracle is a FREE Daily Financial Markets Analysis & Forecasting online publication.