


Quantitative Easing is Nothing New
Interest-Rates / Quantitative Easing Jan 31, 2011 - 03:17 AM GMTBy: Mike_Hewitt

 The term 'quantitative easing' is just the newest term to describe the on-going central bank policy of increasing money supply.
Greetings. There has been an increasing amount of news covering the activities of The US Federal Reserve and other central banks. The newest expression being bantered about is "quantitative easing".
Simply put, quantitative easing is a phrase, more a euphemism really, to describe the process of increasing the monetary supply - printing money so to speak. It is a continuation of actions that central banks have been engaged with ever since their creation.
I would like to show a chart of monetary expansion since 1971 to the present. We will begin with what people most typically think of when they think of money - that being banknotes and coins in public circulation. Economists call this M0.
Here is a chart showing a timeline from 1971 to the end of 2010. Along the vertical axis is a dollar figure.
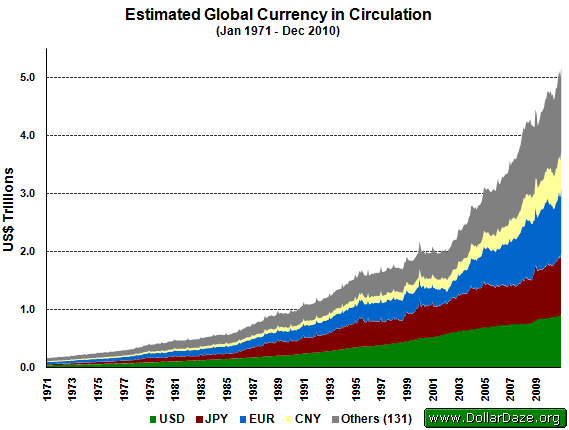
The first currency shown is the US dollar. By the end of 2010 there was 920 billion in US dollars. It is estimated that perhaps up to two-thirds of this circulates outside the borders of the United States.
Our next currency is the Japanese yen. Over 86 trillion yen circulates among the public. This represents an amount equivalent to more than US$1 trillion.
The euro is represented in blue. There is just fewer than 840 billion euros in circulation - equivalent to US$1.1 trillion. These three currencies represent nearly 60 percent of the value of all physical paper currency within the public domain.
The fourth most significant paper currency is the Chinese renminbi, also known as the Chinese yuan.
The remaining 131 currencies shown in this chart are represented in grey. Together, these 135 currencies amount to US$5.2 trillion.
At the end of August 1971, when the US dollar was taken off the last vestiges of the gold standard, the total amount of currency was equivalent to US$171 billion. This means, that over the last 40 years, the nominal valuation of all paper money has increased by more than thirty times.
But, there are also other types of money. Namely, demand deposits and savings accounts. Economists classify different types of money using the following convention.
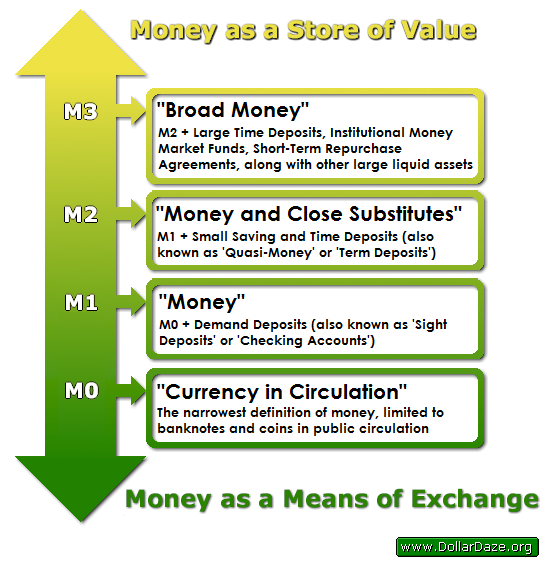
This table shows the different types of money commonly defined by economists. The bottom represents the most liquid forms of money, which are used primarily as a means of exchange. The broadest measure of money defined here, is M3. This includes forms of money used as a store of value.
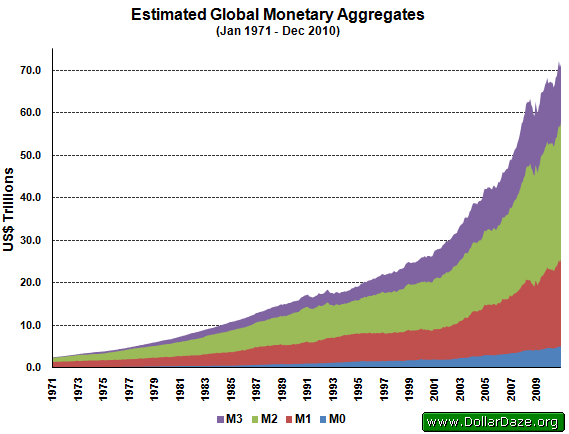
Let's now return to our first chart. We will re-label all of these circulating currencies as M0 and represent them in blue.
Now we will add the global estimates for all demand deposits in order to compute M1. As you can see, the amount of money held in demand deposits exceeds that of currency in circulation by nearly four times.
To this amount of money - equivalent to US$25 trillion - we will now add savings accounts and small time deposits. This is M2. The amount of money in M2 is even greater than that in M1.
Finally, we add in those monies captured under M3.This brings our estimate for the total amount of money to over US$75 trillion.
I hope these charts illustrate the magnitude of monetary expansion that has occurred over the last forty years. Every increase to the existing money supply dilutes the value of the currency already in existence. In other words, those people holding paper money lose purchasing power to create value for the new money. It is, in effect, a transfer of wealth to recipients of newly created money. Quite simply, it is theft.
Common usage of the word "inflation" is the phenomenon of rising prices. I hope that these charts have shown that this price inflation is not a natural process of the free market but, the result of deliberate policy, namely the central bank policy of ever increasing the money supply.
May you find these words helpful in preparing yourself. Thank-you for watching.
Global money supply data available at www.DollarDaze.org
By Mike Hewitt
http://www.dollardaze.org
Mike Hewitt is the editor of www.DollarDaze.org , a website pertaining to commentary on the instability of the global fiat monetary system and investment strategies on mining companies.
Disclaimer: The opinions expressed above are not intended to be taken as investment advice. It is to be taken as opinion only and I encourage you to complete your own due diligence when making an investment decision.
Mike Hewitt Archive |
© 2005-2022 http://www.MarketOracle.co.uk - The Market Oracle is a FREE Daily Financial Markets Analysis & Forecasting online publication.